Ethereum volatility and new targets

The second attempt to new highs
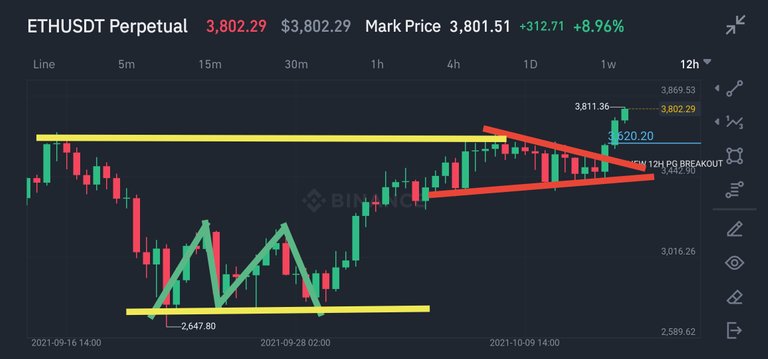
The consolidation in Ethereum seems to have come to an end and a new buying wave could start. On the small time units (12H chart), we last saw a strong support zone at around $2600, a reversal formation was also formed here. The M pattern forms a bottom here and should no longer be undershot. Before the last intermediate high, a recognizable wedge formation was then also formed, this promised further potential on the upside.
Breakout wedge formation and a new 12H PG
The old intermediate high at around $3600 was now broken on the upside and with decent volatility. Supporting here was probably also the new 12H PG, this has formed exactly at this battle zone. The breakout happened very promptly and since then we are around $200 above the trigger.
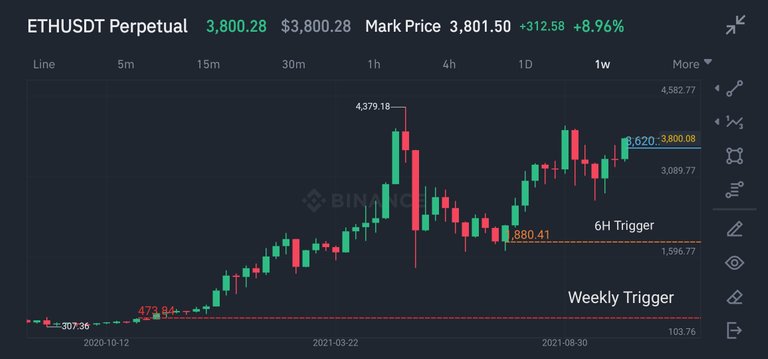
Now it is already the third PG in a cascade of breakouts, Ethereum is just a very technical market. The last breakouts always averaged around $1000 on the 12H chart and that's why my target now is $4600.
Translated with www.DeepL.com/Translator (free version)

Der zweite Anlauf zu neuen Hochständen
Die Konsolidierung im Ethereum scheint ein Ende gefunden zu haben und es könnte eine erneute Kaufwelle einsetzten. Auf den kleinen Zeiteinheiten (12H Chart) sahen wir zuletzt eine starke Support Zone bei rund 2600 Dollar, hier wurde auch eine Umkehrformation gebildet. Das M Pattern bildet hier einen Boden und sollte nicht mehr unterschritten werden. Vor dem letzten Zwischenhoch wurde dann auch eine erkennbare Keilformation gebildet, diese versprach weiteres Potential auf der Oberseite.
Ausbruch Keilformation und eine neue 12H PG
Das alte Zwischenhoch bei rund 3600$ wurde jetzt auf der Oberseite gebrochen und das mit anständiger Volatilität. Unterstützend war hier wohl auch die neue 12H PG, diese hat sich genau an dieser Kampfzone gebildet. Der Ausbruch geschah sehr zeitnah und seitdem liegen wir rund 200$ über dem Trigger.
Jetzt ist es schon die dritte PG in einer Kaskade an Ausbrüchen, Ethereum ist halt ein sehr technischer Markt. Die letzten Ausbrüche ergaben im Durchschnitt immer rund 1000$ auf dem 12H Chart und deshalb liegt mein Ziel jetzt bei 4600$.
Source/Quelle Charts: (Guidants/Godmode Trader) & JFD Broker & Binance
Für mehr Informationen rund ums Trading empfehle ich meinen
Discord Channel: https://discord.gg/j5A3CUq
Twitter: https://mobile.twitter.com/TraderOut
Risikohinweis:
Dieser Post stellt keine Anlageberatung oder sonstige Empfehlung dar.
Die dargestellten Analysen, Techniken und Methoden dienen ausschließlich Informationszwecken
und stellen weder eine individuelle Anlageempfehlung noch ein Angebot zum Kauf oder Verkauf
von Finanzinstrumenten dar, sondern spiegeln lediglich die Meinung des Referenten wider.
Eine Haftung ist ausgeschlossen.
Legal Disclaimer:
I am not a financial advisor
nor is any content in this article presented
as financial advice. Never invest more
than what you can afford to lose.
This post is my personal opinion,
do your own research before making any investment decisions.
If you make any trades after reading this post,
it is completely in your responsibility.
Posted Using LeoFinance Beta