08-05-2024 - Economy - Productivity analysis [EN]-[IT]
~~~ La versione in italiano inizia subito dopo la versione in inglese ~~~
ENGLISH
08-05-2024 - Economy - Productivity analysis [EN]-[IT]
Productivity analysis
Classic production analysis
When we have a company balance sheet at hand, i.e. at our disposal, we can carry out a productive analysis by trying to identify the 4 main indicators:
Productivity of invested capital
Labor Productivity
Average labor cost
Incidence of work
Below we see how these indicators can be obtained if we do not find them explicitly written in the financial statements.
-Productivity of invested capital = added value/invested capital
-Labor productivity = added value/number of employees
-Average labor cost = personnel cost/number of employees
-Incidence of work = personnel costs/sales revenues
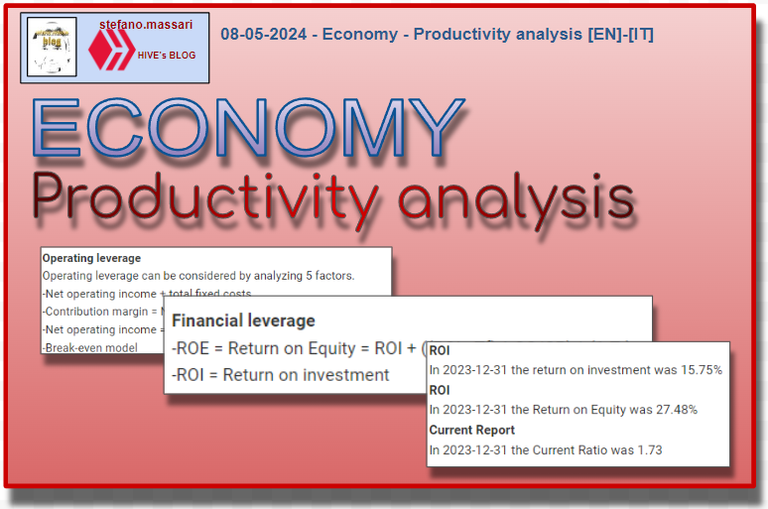
Operating leverage
Operating leverage can be considered by analyzing 5 factors.
-Net operating income + total fixed costs
-Contribution margin = Net operating income + total fixed costs
-Net operating income = contribution margin-total fixed costs
-Break-even model
Financial leverage
-ROE = Return on Equity = ROI + ((ROI - Tf) * CC/CP) * (1-Tr)
-ROI = Return on investment
-Tf = average interest rate on credit capital
-Debt ratio or financial leverage = ratio between credit capital/equity capital (CC/CP)
example
From the following site
ttps://www.juventus.com/it/club/investitori/bilanci-prospetti/bilanci-relazioni we can
download the annual financial report dated 06.30.2020
By reading this document we can obtain the following values:
Debt ratio
On page 97 we find the net financial debt index which is marked with a percentage of 32% on the current item and which is subsequently specified that as at 30 June 2020 this index amounted to €385,164 thousand.
Break-even model
On page 25 we do not find the break-even point data, but we find a description in which it points out that clubs can participate in European competitions only if they demonstrate balance between the revenues generated and the costs incurred which would be the principle of the break-even result
Another example
From the site https://www.macrotrends.net/stocks/charts/TSLA/tesla/roi we can see the ROI, ROE and Current Ratio of TESLA.
ROI
In 2023-12-31 the return on investment was 15.75%
ROI
In 2023-12-31 the Return on Equity was 27.48%
Current Report
In 2023-12-31 the Current Ratio was 1.73
Conclusions
There are several indicators that we can take into consideration when analyzing the productivity of a company and its financial side, among the best known are the Current Ratio, ROI and ROE.
Request
Have you ever tried to understand how a company is doing through financial indicators? If YES, what is your preferred financial indicator, ROE, ROI or Current Ratio?
![]()
ITALIAN
08-05-2024 - Economia - Analisi produttività [EN]-[IT]
Analisi produttività
Analisi produttiva classica
Quando abbiamo un bilancio aziendale sottomano, cioè a nostra disposizione, possiamo fare un’analisi produttiva cercando di identificare i 4 indicatori principali:
Produttività del capitale investito
Produttività del lavoro
Costo medio del lavoro
Incidenza del lavoro
Qui di seguito vediamo come si possono eventualmente ricavare questi indicatori se non li troviamo esplicitamente scritti nel bilancio.
-Produttività del capitale investito = valore aggiunto/capitale investito
-Produttività del lavoro = valore aggiunto/numero dipendenti
-Costo medio del lavoro = costo del personale/numero dei dipendenti
-Incidenza del lavoro = costo del personale/ricavi di vendita
Leva operativa
La leva operativa si può considerare analizzando 5 fattori.
-Reddito operativo netto + costi fissi totali
-Margine di contribuzione = Reddito operativo netto + costi fissi totali
-Reddito operativo netto = margine di contribuzione-costi fissi totali
-Modello del break-even point
La leva finanziaria
-ROE = Return on Equity = ROI + ((ROI - Tf) * CC/CP) * (1-Tr)
-ROI = Return on Investment
-Tf = tasso medio passivo sul capitale di credito
-Indice di indebitamento o leverage = rapporto tra capitale di credito/capitale proprio (CC/CP)
esempio
Dal seguente sito
ttps://www.juventus.com/it/club/investitori/bilanci-prospetti/bilanci-relazioni possiamo
scaricare la relazione finanziaria annuale del 30-06-2020
Leggendo questo documento possiamo ricavare i seguenti valori:
Indice di indebitamento
A pagina 97 troviamo l’indice di Indebitamento finanziario netto che è segnato con una percentuale del 32% sulla voce corrente e che successivamente è specificato che Al 30 giugno 2020 questo indice ammontava a € 385.164 migliaia.
Modello del break-even point
A pagina 25 non troviamo i dati del break-even point, ma troviamo una descrizione in cui fa notare che i club possono partecipare alle competizioni europee solo se dimostrano equilibrio tra i ricavi generati ed i costi sostenuti che sarebbe il principio del break-even result
Altro esempio
Dal sito https://www.macrotrends.net/stocks/charts/TSLA/tesla/roi possiamo vedere il ROI, il ROE ed il Current Ratio di TESLA.
ROI
Nel 2023-12-31 il Return on Investment è stato del 15.75%
ROI
Nel 2023-12-31 il Return on Equity è stato del 27.48%
Current Ratio
Nel 2023-12-31 il Current Ratio è stato del 1.73
Conclusioni
Ci sono diversi indicatori che possiamo tenere in considerazione quando analizziamo la produttività di un azienda e la sua parte finanziaria, tra i più conosciuti troviamo il Current Ratio, il ROI ed il ROE.
Domanda
Avete mai cercato di capire come sta andando un'azienda attraverso gli indicatori finanziari? Se SI, qual è l'indicatore finanziario da voi preferito, il ROE, i ROI o il Current Ratio?
THE END
While making financial indicators, is it very necessary to make use of charts or it isn’t necessary?
Thank you for these educational deliveries. We are not just reading the post, we are learning from them. There are giving us insight on understanding economic principles. Thank you.
Congratulations @stefano.massari! You have completed the following achievement on the Hive blockchain And have been rewarded with New badge(s)
Your next target is to reach 66000 upvotes.
You can view your badges on your board and compare yourself to others in the Ranking
If you no longer want to receive notifications, reply to this comment with the word
STOPCheck out our last posts:
https://twitter.com/lee19389/status/1788334526520819750
#hive #posh
@tipu curate
Upvoted 👌 (Mana: 18/38) Liquid rewards.
I have NOT ventured into this, I will tell you that in the company the work is being overloaded in such a way that I barely have time to enter the panels.