The Masters of Production
Hi Everyone,

People have needs and wants. People are also capable of meeting some of their own needs and wants as well as those of others. As societies and communities grow, there is more scope for specialisation. Specialisation enables people to focus on the tasks they are most proficient at doing. In most cases, people provide outputs for other people. They receive income for their outputs, which they use to pay for goods and services that meet their own needs and wants.
In this post, I want to discuss control over production. Typically, four factors of production are required to produce goods and services. These are labour, capital, land, and entrepreneurship. We own our own labour but we may not own any of the other factors. Even though we own our labour, we may not have full control over it. Forces of demand and supply may determine which outputs can offer us a sustainable income. Competition to provide a service or good may force us to use our labour for alternative outputs. Our employers may pressure us to use our skills for tasks that we would not normally choose to do.
Who controls production?

Factors of production are controlled by the public sector (e.g. Government) and/or the private sector (e.g. privately owned firms). Let us assume that the public sector and the private sector are operating out of self-interest. The people running the public sector (e.g. politicians and top public servants) aim to maintain or obtain more power and authority (discussed in detail in post 'Power, Money, and Me Me Me'). The people running private sector organisations (e.g. entrepreneurs) aim to maximise profit, revenue, and/or market share. The politicians and top public servants need to please the people who have the most influence over their position in Government. The entrepreneurs need to please the people that generate their firm’s revenue (e.g. buy their products). The people who have the most influence over production are those who require pleasing (e.g. customers) by those who produce the goods and services.
Public Sector

Almost all countries have both a public sector and a private sector. The sizes of these sectors vary considerably between countries. How do we measure the sizes of public and private sectors? The public and private sectors should be considered in respect to each other. The easiest place to start is with the public sector and with the size of Government. There are several proposed methods of measuring the size of Government. These methods include:
- employment (e.g. share of overall employment)
- Government expenditure as percentage of National Income (e.g. GDP)
- Government revenue.
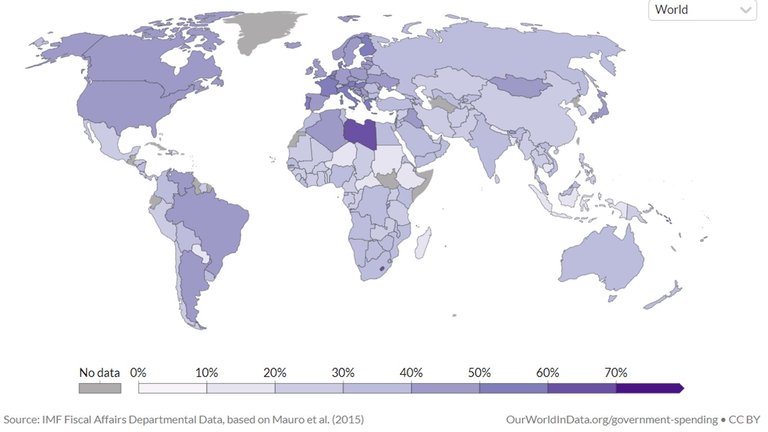
Figure 1 contains the world map highlighting Government expenditure as a percentage of GDP. Countries are shaded in a dark purple to represent Government expenditure as a higher percentage of GDP. Data was not available for countries not shaded.
Figure 1: Government expenditure as a percentage of GDP (2011 or earlier)
Source: Our World in Data
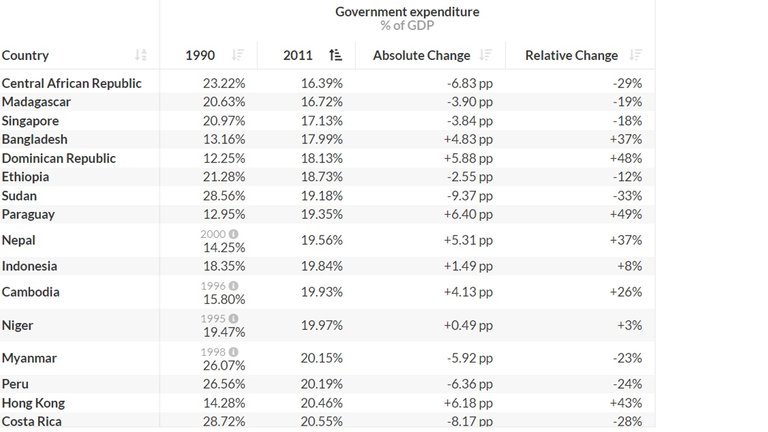
Figure 2 contains the countries with highest Government expenditure as a percentage of GDP and Figure 3 contains the countries with lowest Government expenditure as a percentage of GDP.
Figure 2: Countries with highest Government expenditure as a percentage of GDP
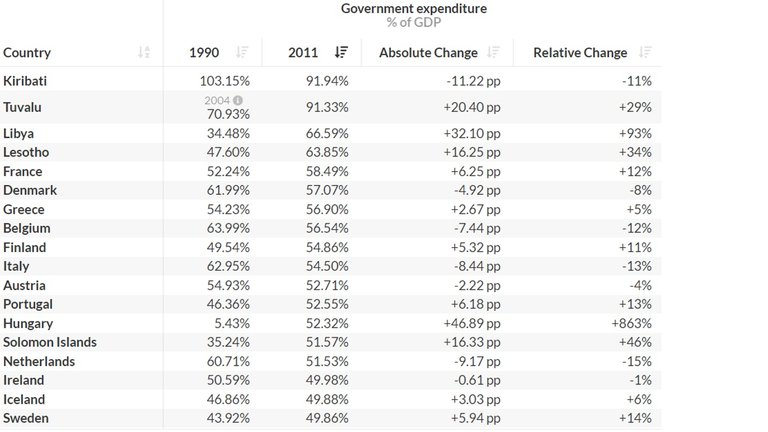
Figure 3: Countries with lowest Government expenditure as a percentage of GDP
Source: Our World in Data
The data is old (2011 and for some countries earlier) but provides a close to complete comparison of Government expenditure as a percentage of GDP for the majority of countries from around the world.
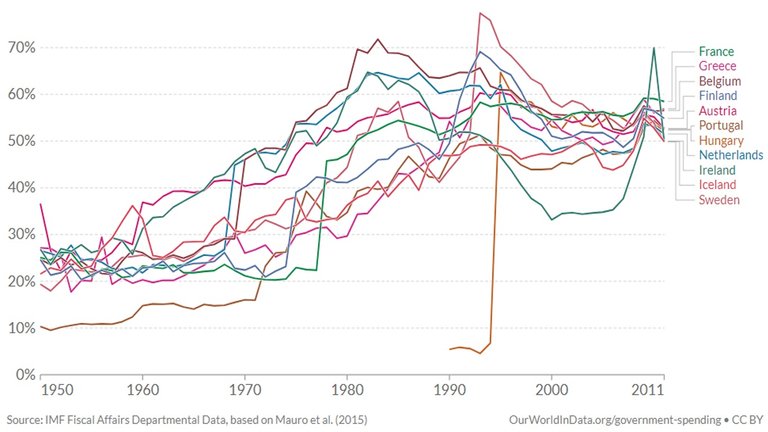
The countries with the highest Government expenditure as a percentage of GDP are predominantly from the European Union (EU) (approximately 2/3). This is an indication that EU countries have large Governments; therefore, have control or strong influence over production. Government expenditure of EU countries has trended upwards until the 1980/90s and have since levelled out and trended towards each other at around 50% to 60% of GDP; see Figure 4.
Figure 4: Government Expenditure as percentage of GDP of selected EU Countries (between 1950 and 2011)
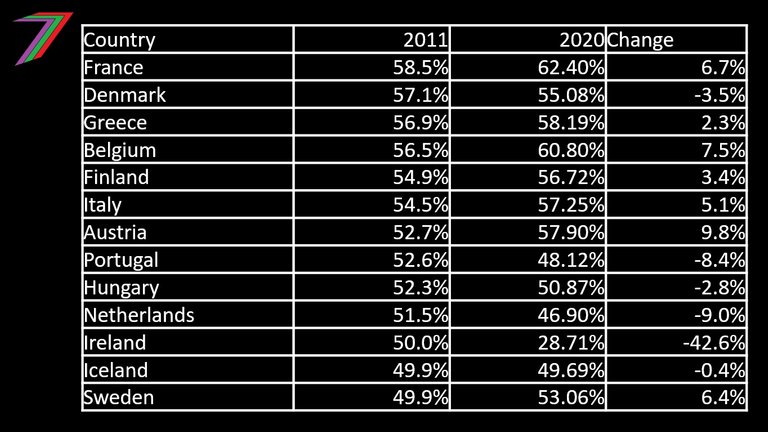
To confirm the size of these Governments, we can compare the 2011 data with 2020 data; see Figure 5 below.
Figure 5: Government Expenditure as percentage of GDP of selected EU Countries (2011 and 2020)
Source: Our World in Data and Wikipedia
As shown in Figure 5, with the exception of Ireland, these EU countries have maintained their level of Government expenditure (within 10% of 2011 values). Therefore, they most likely remain as countries with the highest Government expenditure as a percentage of GDP.
Percentage of the total workforce employed by the Government
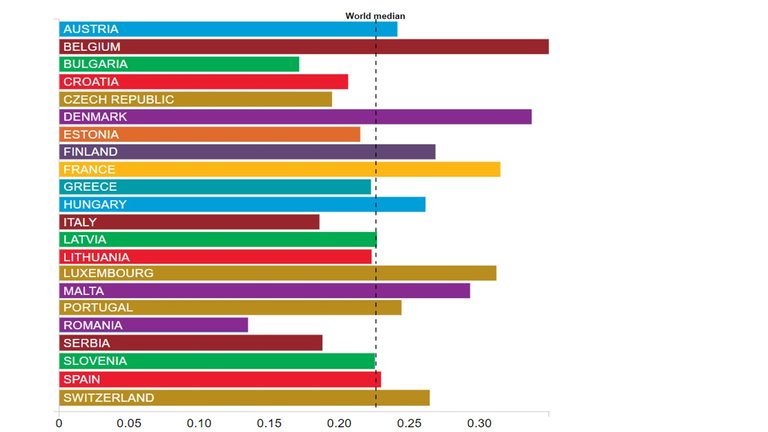
Another criterion of size of Government is the percentage of the total workforce employed by the Government. Figure 6 contains the percentage of the workforce employed by several EU countries (subject to the availability of data).
Figure 6: Percentage of workforce employed by Governments of EU countries (2018)
Source: World Bank
Based on the percentage of the workforce employed by the Government, it does not appear that many of the EU countries have large Governments. The world median is approximately 23%. Roughly, half the Governments of EU countries employ less than 23% of the workforce. Based on World Bank data, only Belgium, Denmark, France, and Luxembourg employed more than 30% of the total workforce in 2018.
How much of Government expenditure is being used to pay Government employees?
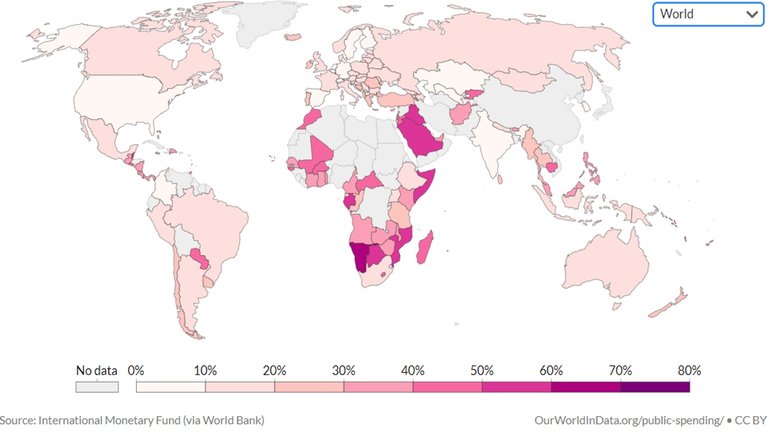
Our World in Data website breaks down Government expenditure of many of the world’s countries into various categories. One of those categories is Government expenditure on Government employees; See map in Figure 7 for comparisons across the world.
Figure 7: Percentage of Central Government Expenditure used to pay Government employees
Source: Our World in Data
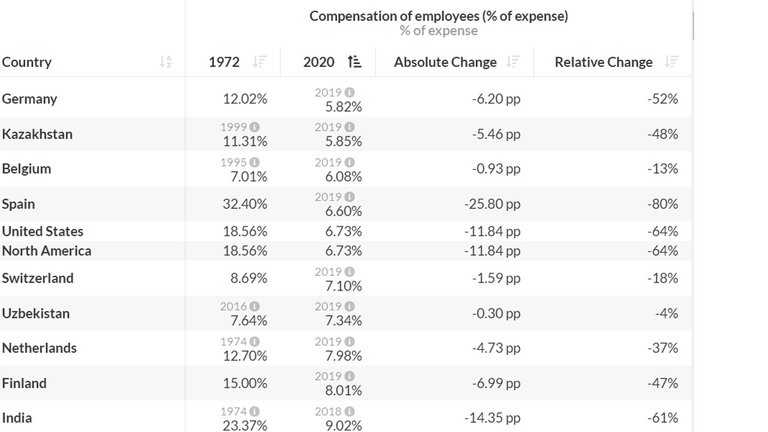
Figure 8 contains the countries with highest percentage of Central Government expenditure used to pay Government employees and Figure 9 contains the countries with lowest percentage of Central Government expenditure used to pay Government employees (Central Government expenditure is used because of limited data for total Government expenditure).
Figure 8: Countries with highest Percentage of Central Government Expenditure used to pay Government employees
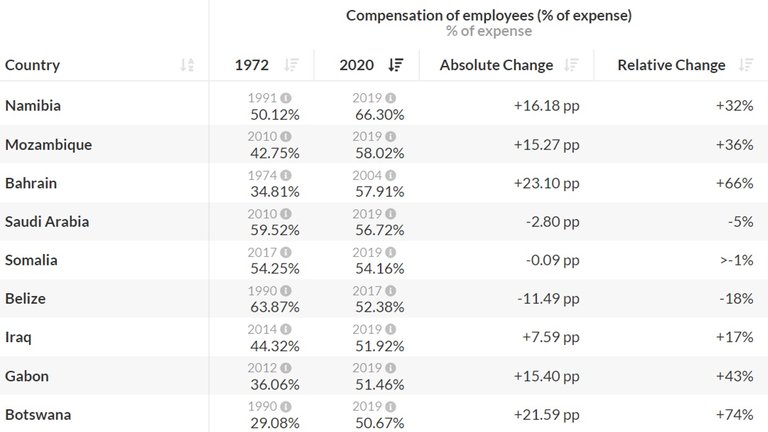
Figure 9: Countries with lowest Percentage of Central Government Expenditure used to pay Government employees
Source: Our World in Data
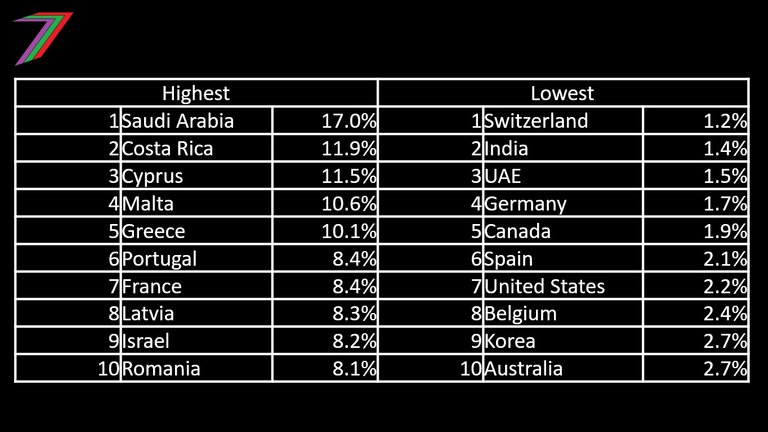
Based on the data available, Governments in Africa and the Middle East (western) appear to spend the highest percentage of Government expenditure on paying Government employees. Western countries appear to spend the lowest percentage of Government expenditure on paying Government employees (three of the bottom five countries are from the EU (Germany, Belgium, and Spain)). This does not create a clear picture of which countries Governments are spending the most on Government employees as different countries have different levels of overall Government expenditure. Therefore, for a fairer comparison between countries, Government expenditure on Government employees should be presented as a percentage of GDP. Figure 10 contains the countries that spend the highest percentage of GDP on employees as well as the lowest percentage of GDP on Government employees.
Figure 10: Countries with the highest and lowest expenditure on Government employees as a percentage of GDP
Source: Adjusted based on data from Our World in Data
Note: country sample size reduced to 52 countries.
Government expenditure on Government employees as percentage of GDP combines the metrics of Government expenditure as a percentage of GDP and Government expenditure on employees as a proxy for Government employment to provide more insight into the size of Government.
Based on the criterion of Government expenditure on Government employees as a percentage of GDP, Saudi Arabia can be considered to have the largest Government. However, seven of the other nine countries are from the EU. Based on the same criterion, Switzerland can be considered to have the smallest Government.
Governments use of the private sector
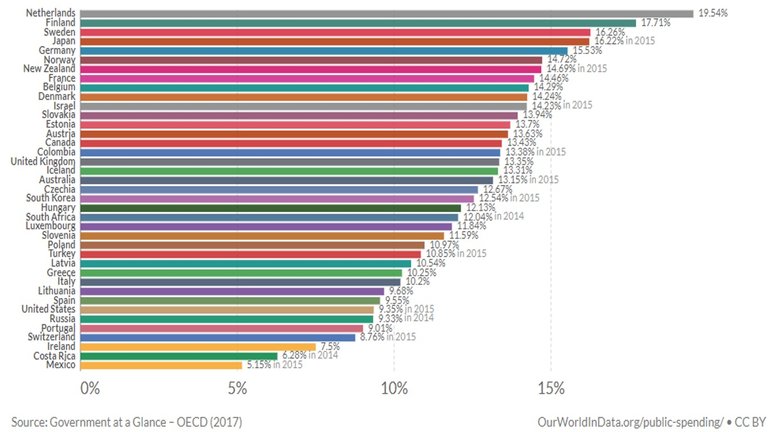
For many countries, procurement makes up a large proportion of Government expenditure. Procurement involves Governments paying private sector firms to produce and manage goods and services. In this case, Government determines the goods and services to be produced by selected private companies rather than owning the factors of production to produce the goods and services themselves. Figure 11 contains Government expenditure on procurement as a percentage of GDP (limited to a few countries where this data is available).
Figure 11: Government expenditure on procurement as a percentage of GDP (mostly 2016)
Source: Our World in Data
Eight of the top ten countries with the highest Government expenditure on procurement as a percentage of GDP are from the EU. Governments of EU countries such as Germany, Finland, Netherlands, and Sweden rely heavily on the private sector for goods and services and others such as France and Norway appear to rely heavily on both their own production capacity as well as the private sector.
Procurement is not the only form of Government expenditure that is paid to the private sector. Components of other Government expenditure such as health, education, military, and social protection are paid to the private sector. However, there is insufficient data to compare these components of expenditure between countries.
Figure 12 compares Government expenditure as a percentage of GDP (GT), Central Government expenditure as a percentage of GDP (GC), Government expenditure on Government employees as a percentage of GDP (GCE), Government expenditure on procurement as a percentage of GDP (P), Government expenditure minus procurement as a percentage of GDP (GTAP), and percentage of workforce employed by Governments (GE).
Figure 12: Comparisons of sizes of Governments of 52 countries
| Country | GT | GC | GCE | P | GTAP | GE |
|---|---|---|---|---|---|---|
| Australia | 45.0% | 26.1% | 2.75% | 13.2% | 31.8% | 18.0% |
| Austria | 57.9% | 43.5% | 4.73% | 13.6% | 44.3% | 15.1% |
| Belgium | 60.8% | 39.6% | 2.41% | 14.3% | 46.5% | 21.1% |
| Brazil | 42.7% | 34.7% | 4.13% | 12.3% | ||
| Bulgaria | 38.8% | 32.7% | 6.04% | 21.1% | ||
| Canada | 52.4% | 18.1% | 1.91% | 13.4% | 39.0% | 20.2% |
| Colombia | 33.4% | 30.9% | 3.07% | 13.4% | 20.1% | 3.7% |
| Costa Rica | 22.9% | 29.9% | 11.9% | 6.3% | 16.7% | 13.9% |
| Croatia | 55.0% | 38.5% | 6.19% | 30.1% | ||
| Cyprus | 47.4% | 38.5% | 11.5% | |||
| Czech Republic | 47.9% | 32.8% | 4.51% | 12.7% | 35.2% | 15.4% |
| Denmark | 55.1% | 35.7% | 4.12% | 14.2% | 40.8% | 29.6% |
| Estonia | 44.7% | 35.6% | 6.43% | 13.7% | 31.0% | 23.8% |
| Finland | 56.7% | 37.0% | 2.97% | 17.7% | 39.0% | 26.1% |
| France | 62.4% | 46.5% | 8.41% | 14.5% | 47.9% | 20.5% |
| Germany | 51.1% | 28.5% | 1.66% | 15.5% | 35.6% | 12.9% |
| Greece | 58.2% | 46.7% | 10.2% | 10.3% | 47.9% | 21.3% |
| Hungary | 50.9% | 39.1% | 7.65% | 12.1% | 38.7% | 24.8% |
| Iceland | 49.7% | 28.8% | 7.98% | 13.3% | 36.4% | |
| India | 31.7% | 15.7% | 1.41% | 3.8% | ||
| Ireland | 28.7% | 22.2% | 5.95% | 7.5% | 21.2% | 17.9% |
| Israel | 46.4% | 36.6% | 8.22% | 14.2% | 32.2% | 18.5% |
| Italy | 57.3% | 42.5% | 5.74% | 10.2% | 47.1% | 16.0% |
| Korea South | 25.6% | 27.6% | 2.65% | 12.5% | 13.1% | 10.3% |
| Latvia | 42.5% | 43.9% | 8.28% | 10.5% | 32.0% | 29.5% |
| Lithuania | 42.0% | 32.7% | 5.43% | 9.7% | 32.3% | 26.9% |
| Luxembourg | 47.5% | 38.8% | 8.03% | 11.8% | 35.7% | 22.1% |
| Malaysia | 25.4% | 17.4% | 5.33% | 15.1% | ||
| Malta | 45.9% | 34.3% | 10.6% | |||
| Netherlands | 46.9% | 37.4% | 2.99% | 19.5% | 27.4% | 19.9% |
| New Zealand | 42.4% | 30.1% | 7.44% | 14.7% | 27.7% | 11.5% |
| Macedonia | 36.7% | 29.8% | 4.09% | 23.1% | ||
| Norway | 58.2% | 39.0% | 6.06% | 14.7% | 43.4% | 32.4% |
| Philippines | 25.1% | 14.8% | 5.71% | 9.0% | ||
| Poland | 48.9% | 34.2% | 4.79% | 11.0% | 38.0% | 23.6% |
| Portugal | 48.1% | 38.6% | 8.44% | 9.0% | 39.1% | 14.7% |
| Romania | 38.8% | 33.8% | 8.07% | 16.0% | ||
| Russia | 38.8% | 29.7% | 3.90% | 9.3% | 29.5% | 40.6% |
| Saudi Arabia | 40.3% | 29.9% | 17.0% | |||
| Serbia | 48.6% | 37.4% | 6.22% | 25.1% | ||
| Singapore | 26.6% | 14.2% | 3.48% | 32.0% | ||
| Slovak Republic | 49.6% | 40.2% | 6.10% | 13.9% | 35.6% | 26.9% |
| Slovenia | 53.2% | 37.6% | 7.39% | 11.6% | 41.6% | 20.9% |
| South Africa | 40.1% | 38.1% | 5.28% | 12.0% | 28.1% | 16.9% |
| Spain | 52.3% | 32.3% | 0.21% | 9.6% | 42.7% | 16.3% |
| Sweden | 53.1% | 31.3% | 2.96% | 16.3% | 36.8% | 29.2% |
| Switzerland | 36.3% | 16.6% | 1.18% | 8.8% | 27.5% | 13.8% |
| Thailand | 25.3% | 17.9% | 4.82% | 9.3% | ||
| Turkey | 34.6% | 35.5% | 7.99% | 10.9% | 23.8% | 13.3% |
| UAE | 32.0% | 4.2% | 1.46% | |||
| United Kingdom | 50.3% | 36.8% | 6.10% | 13.4% | 36.9% | 21.5% |
| United States | 46.2% | 33.0% | 2.22% | 9.4% | 36.8% | 13.3% |
| World | 28.8% | 6.25% |
Sources: Our World in Data and Wikipedia
Government and Monopsony

Production occurs in both the public sector and the private sector. Governments can engage directly in production, they can work jointly with the private sector, or they can rely entirely on the private sector.
Engaging directly in production gives Governments control and ownership over land and capital factors of production and control over labour. Entrepreneurship does not exist, as profitability is not necessary for Government organisations (e.g. State Owned Enterprises) to continue operations.
Relying on the private sector for production gives Government control over what is produced but not the production process itself. The private sector controls factors of production such as land, capital, labour and entrepreneurship. The private sector is normally considered more efficient than the public sector. However, this efficiency occurs through competition and the incentive to make profits. This is not likely to occur, as the Government is likely to be the only buyer (monopsony). Therefore, the only customer the firm needs to please. Even though the Government, supposedly, represents many customers (e.g. taxpayers), it makes decisions based on its own self-interest (see beginning of post). Once the Government becomes the customer, there is very little incentive for the chosen firm to be efficient or improve quality of output.
Working together is likely to be mutually beneficial to both Government and the firms offering the goods and services.
Governments can claim to be addressing their citizen’s needs by stating how much money they are dedicating to providing an output (i.e. Governments often promote high expenditure as addressing a problem and usually neglect the actual outcome of the expenditure). Governments do not need to worry about production processes. Firms, normally large, that profit from business with the Government may offer favours in return to the Government (e.g. help them promote their agendas or use their influence to improve the image of the Government).
Firms benefit from Government contracts because they can be very profitable. They are likely to face limited competition because of the scale of work required. They only to meet the needs of the Government and are unlikely to face direct feedback from the people the Government are representing. They can obtain more work during economic downturns, as high Government expenditure is often counter cyclical (e.g. expansionary fiscal policy).
Quick Assessment on Size of Government

I do not believe size of Government should be determined by a single metric (e.g. employment or expenditure). Instead, several metrics should be combined to present a clearer picture in regards to size. I do not believe size of Government can be described as either large or small. As different Governments, operate differently. Therefore, I have divided size of Government into small, large with control and ownership of resources, and large with control but limited ownership of resources.
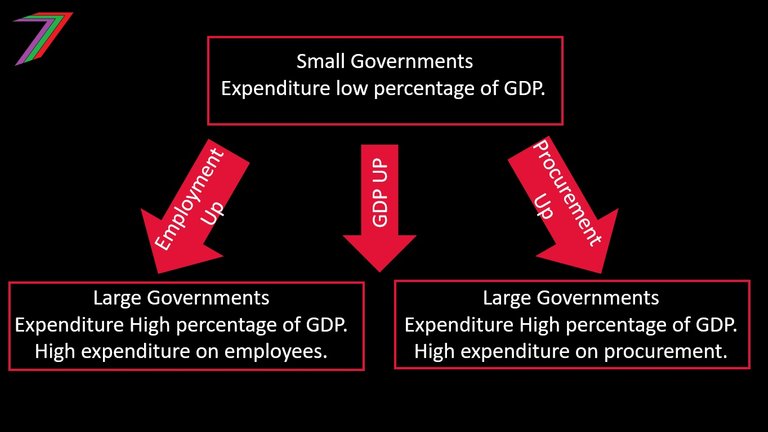
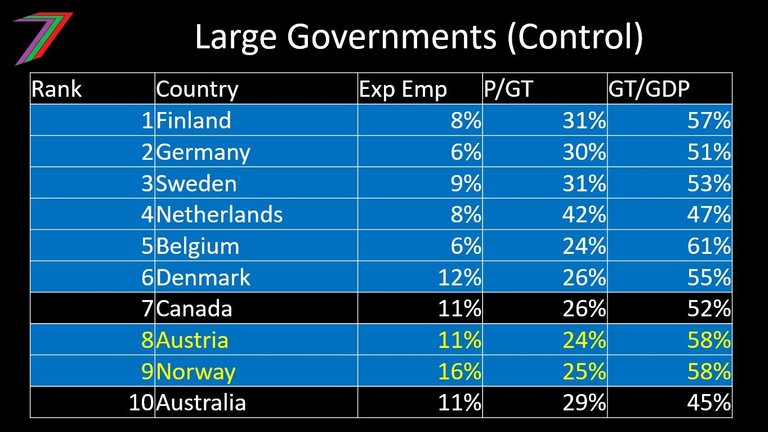
I have used Government expenditure to distinguish between small and large types of Governments. I have used percentage of Government expenditure on Government employees and percentage of Government expenditure on procurement to distinguish between large Governments that prefer to produce goods and services themselves to Governments that outsource production of goods and services. This has been done by summating a simple ranking of each countries Government in relation to each other.
Figures 13, 14, and 15 contain countries with relatively small Governments, relatively large Governments with control and ownership of resources, and relatively large Governments with control but limited ownership of resources respectively.
Figure 13: Smaller Governments (based on available data)
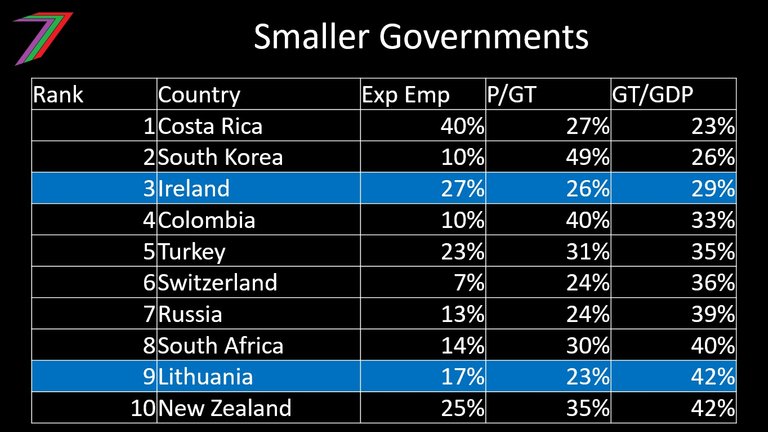
Figure 14: Large Governments with control and ownership of resources (based on available data)
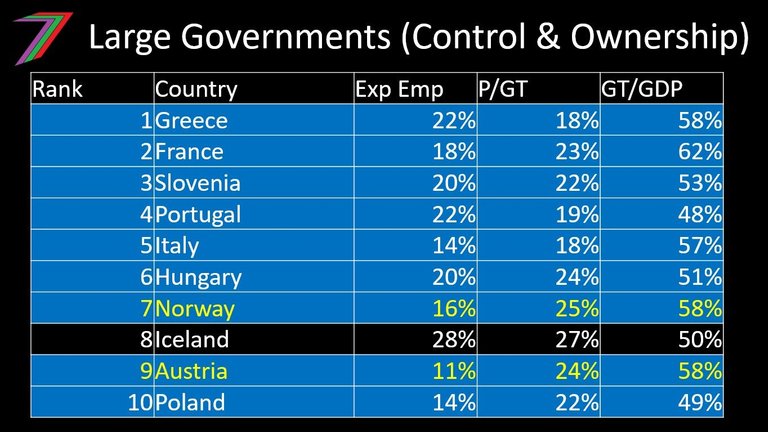
Figure 15: Large Governments with control but limited ownership of resources (based on available data)
Source: Based on data from Our World in Data
Note: Blue represents EU countries
Legend:
Exp Emp: Percentage of Government expenditure on Government employees
P/GT: Procurement as a percentage of Government expenditure
GT/GDP: Government expenditure as percentage of GDP
Approximately, three quarters of countries with sufficient data to make comparisons based on the criteria described are from the EU; see Figure 12 for all the countries with complete sets of data required to make comparisons. Therefore, it is expected that EU countries would dominate the tables and rankings presented. Even when compared with a limited number of countries, it is apparent most EU countries are inclined towards large Governments; this is apparent when we consider the countries with the smaller Governments.
Austria and Norway (in yellow font) appear on both large Government lists; this is because of the relatively small number of countries considered and that Government expenditure as a percentage of GDP is a criterion for both groups. Out of the 37 countries in the dataset, both Norway and Austria are in the top five countries for highest Government expenditure as a percentage of GDP.
Based on 2021 GDP data from the International Monetary Fund (IMF), the average GDP per capita of countries in Figure 15 are almost 25% higher than average GDP per capita of countries in Figure 14. Could cooperation between Governments and the private sector be increasing the wealth of a country? Could it be a transfer of wealth instead of destruction of it through Government wastage and inefficiency? More research and analysis is needed to provide a more complete picture.
The bigger the better or maybe not

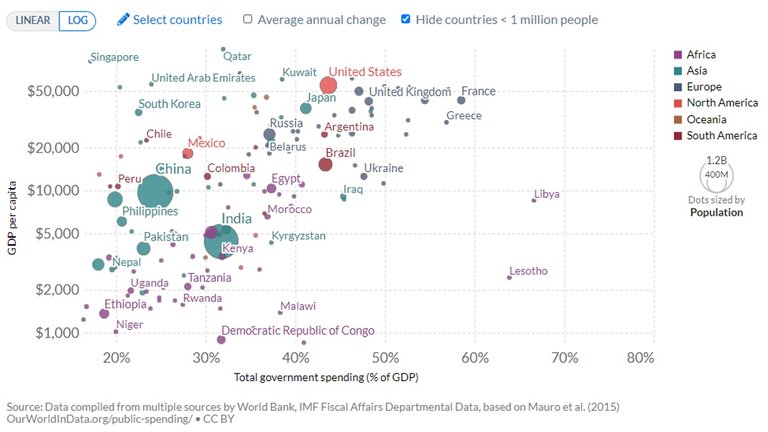
Many of the countries with highest Government expenditure as a percentage of GDP are also some of the wealthiest countries in terms of GDP per capita. Very few countries with high Government expenditure as a percentage of GDP have relatively lower GDP per capita. Countries with low Government expenditure as a percentage of GDP are widely spread between varying levels of GDP. See Figure 16 for comparisons of GDP per capita between countries with different Government expenditure.
Figure 16: GDP per capita vs Government expenditure (2015)
Source: Our World in Data
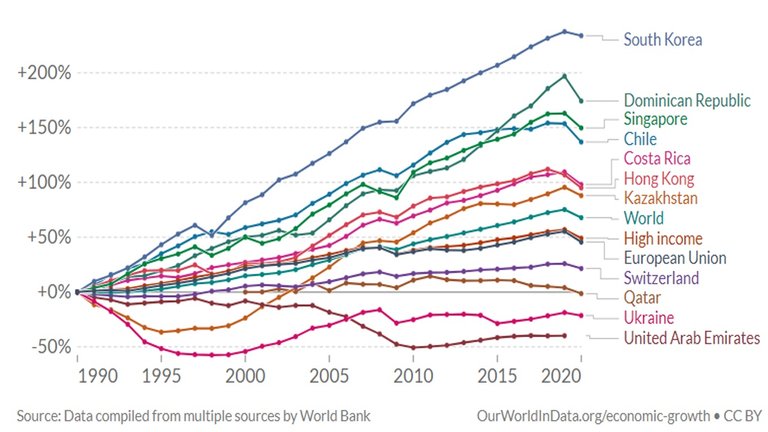
There is a correlation between large Governments and GDP per capita. However, this does not determine causation. Does one cause the other or is the relationship spurious? To answer this question definitively, would require an in-depth investigation. However, a simple analysis could still offer us some insight. We could consider both changes in GDP per capita and Government expenditure over time. Earlier in the post (Figure 4), we demonstrated that Government expenditures as a percentage of GDP of EU countries have increased considerably up until around the 1980s and 1990s, after that they have remained close to constant. Let us consider how GDP per capita has grown for EU countries when compared with other countries with relatively high GDP per capita but considerably smaller Governments. See Figure 17 for this comparison between 1990 and 2020.
Figure 17: Change in GDP per capita of EU countries and countries with smaller Governments (1990 to 2020)
Source: Our World in Data
The growth in GDP per capita for EU countries is below most other countries with smaller Governments and comparable GDP per capita based on the 2011 data. Growth in GDP per capita is also below the world average and slightly below the average for high-income countries. Many of the EU countries became relatively wealthy prior to their growth in Government size. It appears unlikely that large Government is the cause of higher GDP per capita. It is possible that the reverse could be true. Higher wealth may have enabled the growth of Government; more analysis is needed.
Many of the countries that have small Governments are located in Africa. On the continent of Africa, over 80% of production and approximately 90% of the population are employed in the private sector (African Union). Prosperity in Africa is hindered by decades of exploitation by Western countries, frequent and continuous wars, and corruption. It is difficult to determine the extent the size of Government plays in determining the wealth of African nations.
Private Sector

If Governments are not involved in production as either a producer or a customer, market forces influences (not necessarily determines as Governments can still intervene in markets without necessarily participating) what is produced, how it is produced, and who produces it. Firms respond to market forces by competing with each other to meet the demand from their customers.
Firms can vary greatly in size. Size of firms depend on market structure. Market structure is influenced by many factors. These factors include:
- Barriers to entry (e.g. high start-up costs)
- Nature of product (e.g. highly differentiated)
- Cost structures (e.g. scope for economies of scale)
- Number of potential customers (e.g. niche market)
- Transportability of product (e.g. constrained by location)
- Government intervention (e.g. taxes)
If there are no barriers to entry; products are homogenous; economies of scale are limited; there are a large number of customers; product is easily transportable; and there is no Government intervention, the market structure is likely to be close to perfect competition (many small firms with homogenous products). Instead, if the products are differentiated, the market structure is more likely to resemble monopolistic competition (many small firms with differentiated products). If there are barriers to entry and economies of scale, the market structure is likely to resemble an oligopoly (few large firms) or even a monopoly (just one firm).
The market structures and sizes of firms vary for different countries. Figure 18 compares the percentage of people employed in countries from across the world (where data is available).
Figure 18: Employment based on firm size (number of employees) (2019 manufacturing data)
| Country | 1 to 9 | 10 to 19 | 20 to 49 | 49 to 250 | 250+ | Rank |
|---|---|---|---|---|---|---|
| Austria | 5% | 5% | 9% | 23% | 58% | 5 |
| Belgium | 6% | 6% | 12% | 25% | 52% | 13 |
| Brazil | 7% | 8% | 12% | 20% | 52% | 9 |
| Bulgaria | 8% | 7% | 15% | 32% | 37% | 28 |
| Colombia | 1% | 4% | 11% | 38% | 45% | 19 |
| Costa Rica | 7% | 5% | 9% | 23% | 55% | 7 |
| Croatia | 13% | 8% | 13% | 24% | 42% | 22 |
| Cyprus | 25% | 13% | 16% | 25% | 21% | 40 |
| Czech Republic | 5% | 5% | 10% | 28% | 52% | 11 |
| Denmark | 7% | 6% | 11% | 28% | 48% | 18 |
| Estonia | 11% | 8% | 16% | 40% | 24% | 39 |
| Finland | 7% | 6% | 11% | 25% | 50% | 16 |
| France | 8% | 6% | 8% | 16% | 63% | 2 |
| Germany | 4% | 6% | 8% | 20% | 62% | 3 |
| Greece | 18% | 12% | 17% | 26% | 27% | 36 |
| Hungary | 7% | 6% | 9% | 23% | 55% | 8 |
| Iceland | 11% | 9% | 15% | 36% | 28% | 34 |
| Ireland | 8% | 5% | 10% | 27% | 50% | 17 |
| Israel | 9% | 7% | 12% | 31% | 41% | 23 |
| Italy | 13% | 14% | 17% | 25% | 31% | 33 |
| Japan | 5% | 8% | 17% | 33% | 37% | 29 |
| Korea | 0% | 16% | 25% | 32% | 27% | 35 |
| Latvia | 14% | 8% | 17% | 36% | 25% | 38 |
| Lithuania | 8% | 7% | 14% | 34% | 37% | 30 |
| Luxembourg | 3% | 2% | 9% | 28% | 57% | 6 |
| Malta | 11% | 8% | 15% | 8% | 36% | 31 |
| Netherlands | 9% | 8% | 14% | 34% | 35% | 32 |
| Macedonia | 13% | 7% | 12% | 29% | 39% | 24 |
| Norway | 8% | 8% | 15% | 31% | 38% | 26 |
| Poland | 9% | 6% | 10% | 24% | 51% | 15 |
| Portugal | 13% | 11% | 18% | 33% | 25% | 37 |
| Romania | 8% | 6% | 11% | 24% | 51% | 14 |
| Russia | 0% | 0% | 1% | 14% | 86% | 1 |
| Serbia | 6% | 6% | 10% | 26% | 52% | 12 |
| Slovak Republic | 9% | 4% | 9% | 25% | 52% | 10 |
| Slovenia | 10% | 7% | 11% | 27% | 45% | 20 |
| Spain | 12% | 9% | 16% | 24% | 39% | 25 |
| Sweden | 7% | 5% | 8% | 19% | 62% | 4 |
| Turkey | 14% | 0% | 0% | 27% | 38% | 27 |
| United Kingdom | 9% | 6% | 12% | 27% | 45% | 21 |
Source: Converted to percentages using data from OECD
Note: Rank is according to countries with the highest percentage of employment in large firms (250+ employees)
Of the 40 countries, where data was available, the Russian private sector appears to be the most dominated by large firms; large firms employ more than 80% of people that are employed in manufacturing. Large firms also dominate the private sectors of Sweden, France, and Germany; more than 60% of people that are employed in manufacturing are employed by large firms.
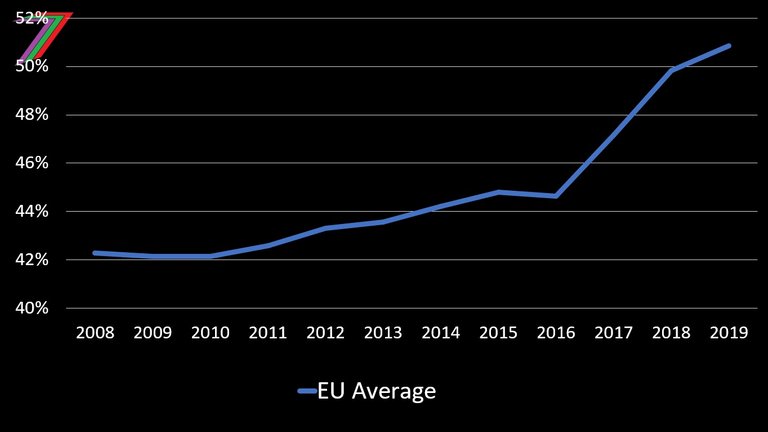
On average, for EU countries, large firms are gaining a larger proportion of employment. Since 2008, the percentage of people employed by large firms in the private sector has increased from 42% to 51%. See Figure 19 below.
Figure 19: EU countries employment by large firms (2008 to 2019 manufacturing data)
Source: Converted to percentages using data from OECD
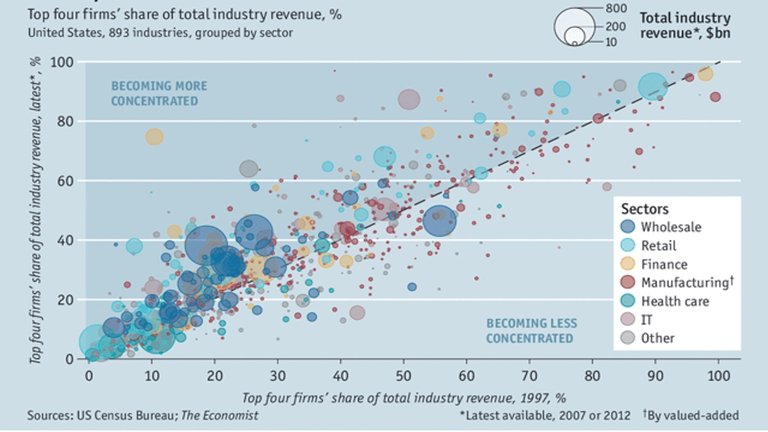
Another approach to assessing firm size and market structure is through concentration ratios. Figure 20 contains changes in the market concentration of the four largest firms in various industries in the US between 1997 and 2012.
Figure 20: Changes in market concentration based on revenue in the US
Source: Economist
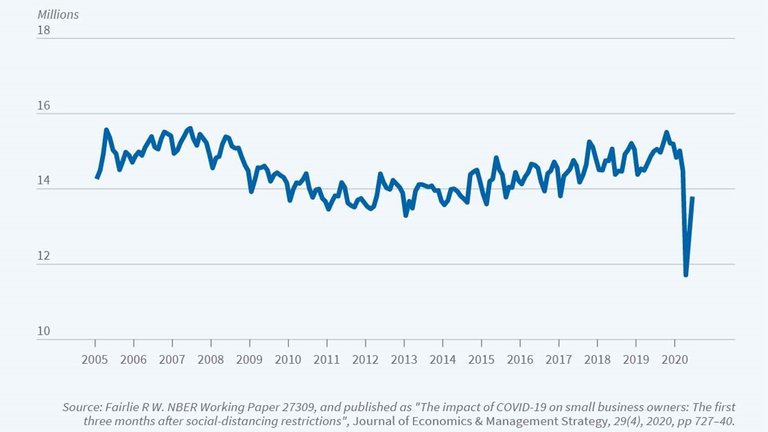
Based on data for the EU and US, it appears that larger firms are becoming more dominant in terms of percentage of employees as well as percentage of revenue earned. The Covid-19 restrictions of 2020 and 2021 can be expected to further increase large firm dominance as many small firms have been forced to close permanently. See Figure 21 for changes in the number of active firms in the US.
Figure 21: Number of Active Business Owners in the US 2005 to 2020
Source: NBER
The growth of large firms and the decline of smaller ones is likely to continue as conditions continue to harshen for firms. Operating costs rise due to previous Covid-19 policies as well as aggressive sanctions on Russia. Surviving small firms have less financial reserves to cope. Large firms can take advantage by capturing greater market share, which will eventually lead to higher revenue and profits.
My Opinions

It appears the majority of the population are moving further away from controlling or even influencing production. Large Governments put production decisions in the hands of a few politicians, who utilise Government agencies or the private sector to deliver based on their decisions. Large firms are growing and small firms are failing. Production decisions are determined by the few at the top of these organisations and the rest of the population become employees far removed from major decisions. The power of market operations are reduced as Governments make decisions on behalf of its population and large firms lack competition to be compelled to adequately meet the needs of their customers. For example, baby formula shortages in the US are being caused by market dominance of a few large firms (Abbott Laboratories, Mead Johnson, and Nestle); see Fortune for more detail.
The Great Reset is the World Economic Forum’s proposed solution to the problems they claim have been exposed by Covid-19 and now possibly the war in Ukraine. In my post, My summary and opinions regarding ‘The Great Reset’ – Part 6: Conclusion, my first three conclusions regarding the aims of Great Reset proposals were:
- They strongly supported centralisation of control and governance for both Government and the private sector.
- They strongly supported globalisation through centralisation of governance through international bodies.
- They opposed predominantly free market economies.
From the data I have explored in this post, it appears the goals of the Great Reset have been in progress in the EU for several decades. The initiatives proposed by the World Economic Forum are most likely intended to hasten the EU approach as well as promote greater adoption of this approach in other countries.
More posts

If you want to read any of my other posts, you can click on the links below. These links will lead you to posts containing my collection of works. These 'Collection of Works' posts have been updated to contain links to the Hive versions of my posts.
Hive: Future of Social Media

Spectrumecons on the Hive blockchain


Congratulations @spectrumecons! You have completed the following achievement on the Hive blockchain and have been rewarded with new badge(s):
Your next target is to reach 80000 upvotes.
You can view your badges on your board and compare yourself to others in the Ranking
If you no longer want to receive notifications, reply to this comment with the word
STOPThis post has been manually curated by @steemflow from Indiaunited community. Join us on our Discord Server.
Do you know that you can earn a passive income by delegating to @indiaunited. We share 100 % of the curation rewards with the delegators.
Here are some handy links for delegations: 100HP, 250HP, 500HP, 1000HP.
Read our latest announcement post to get more information.
Please contribute to the community by upvoting this comment and posts made by @indiaunited.