2 June My Technical Analysis

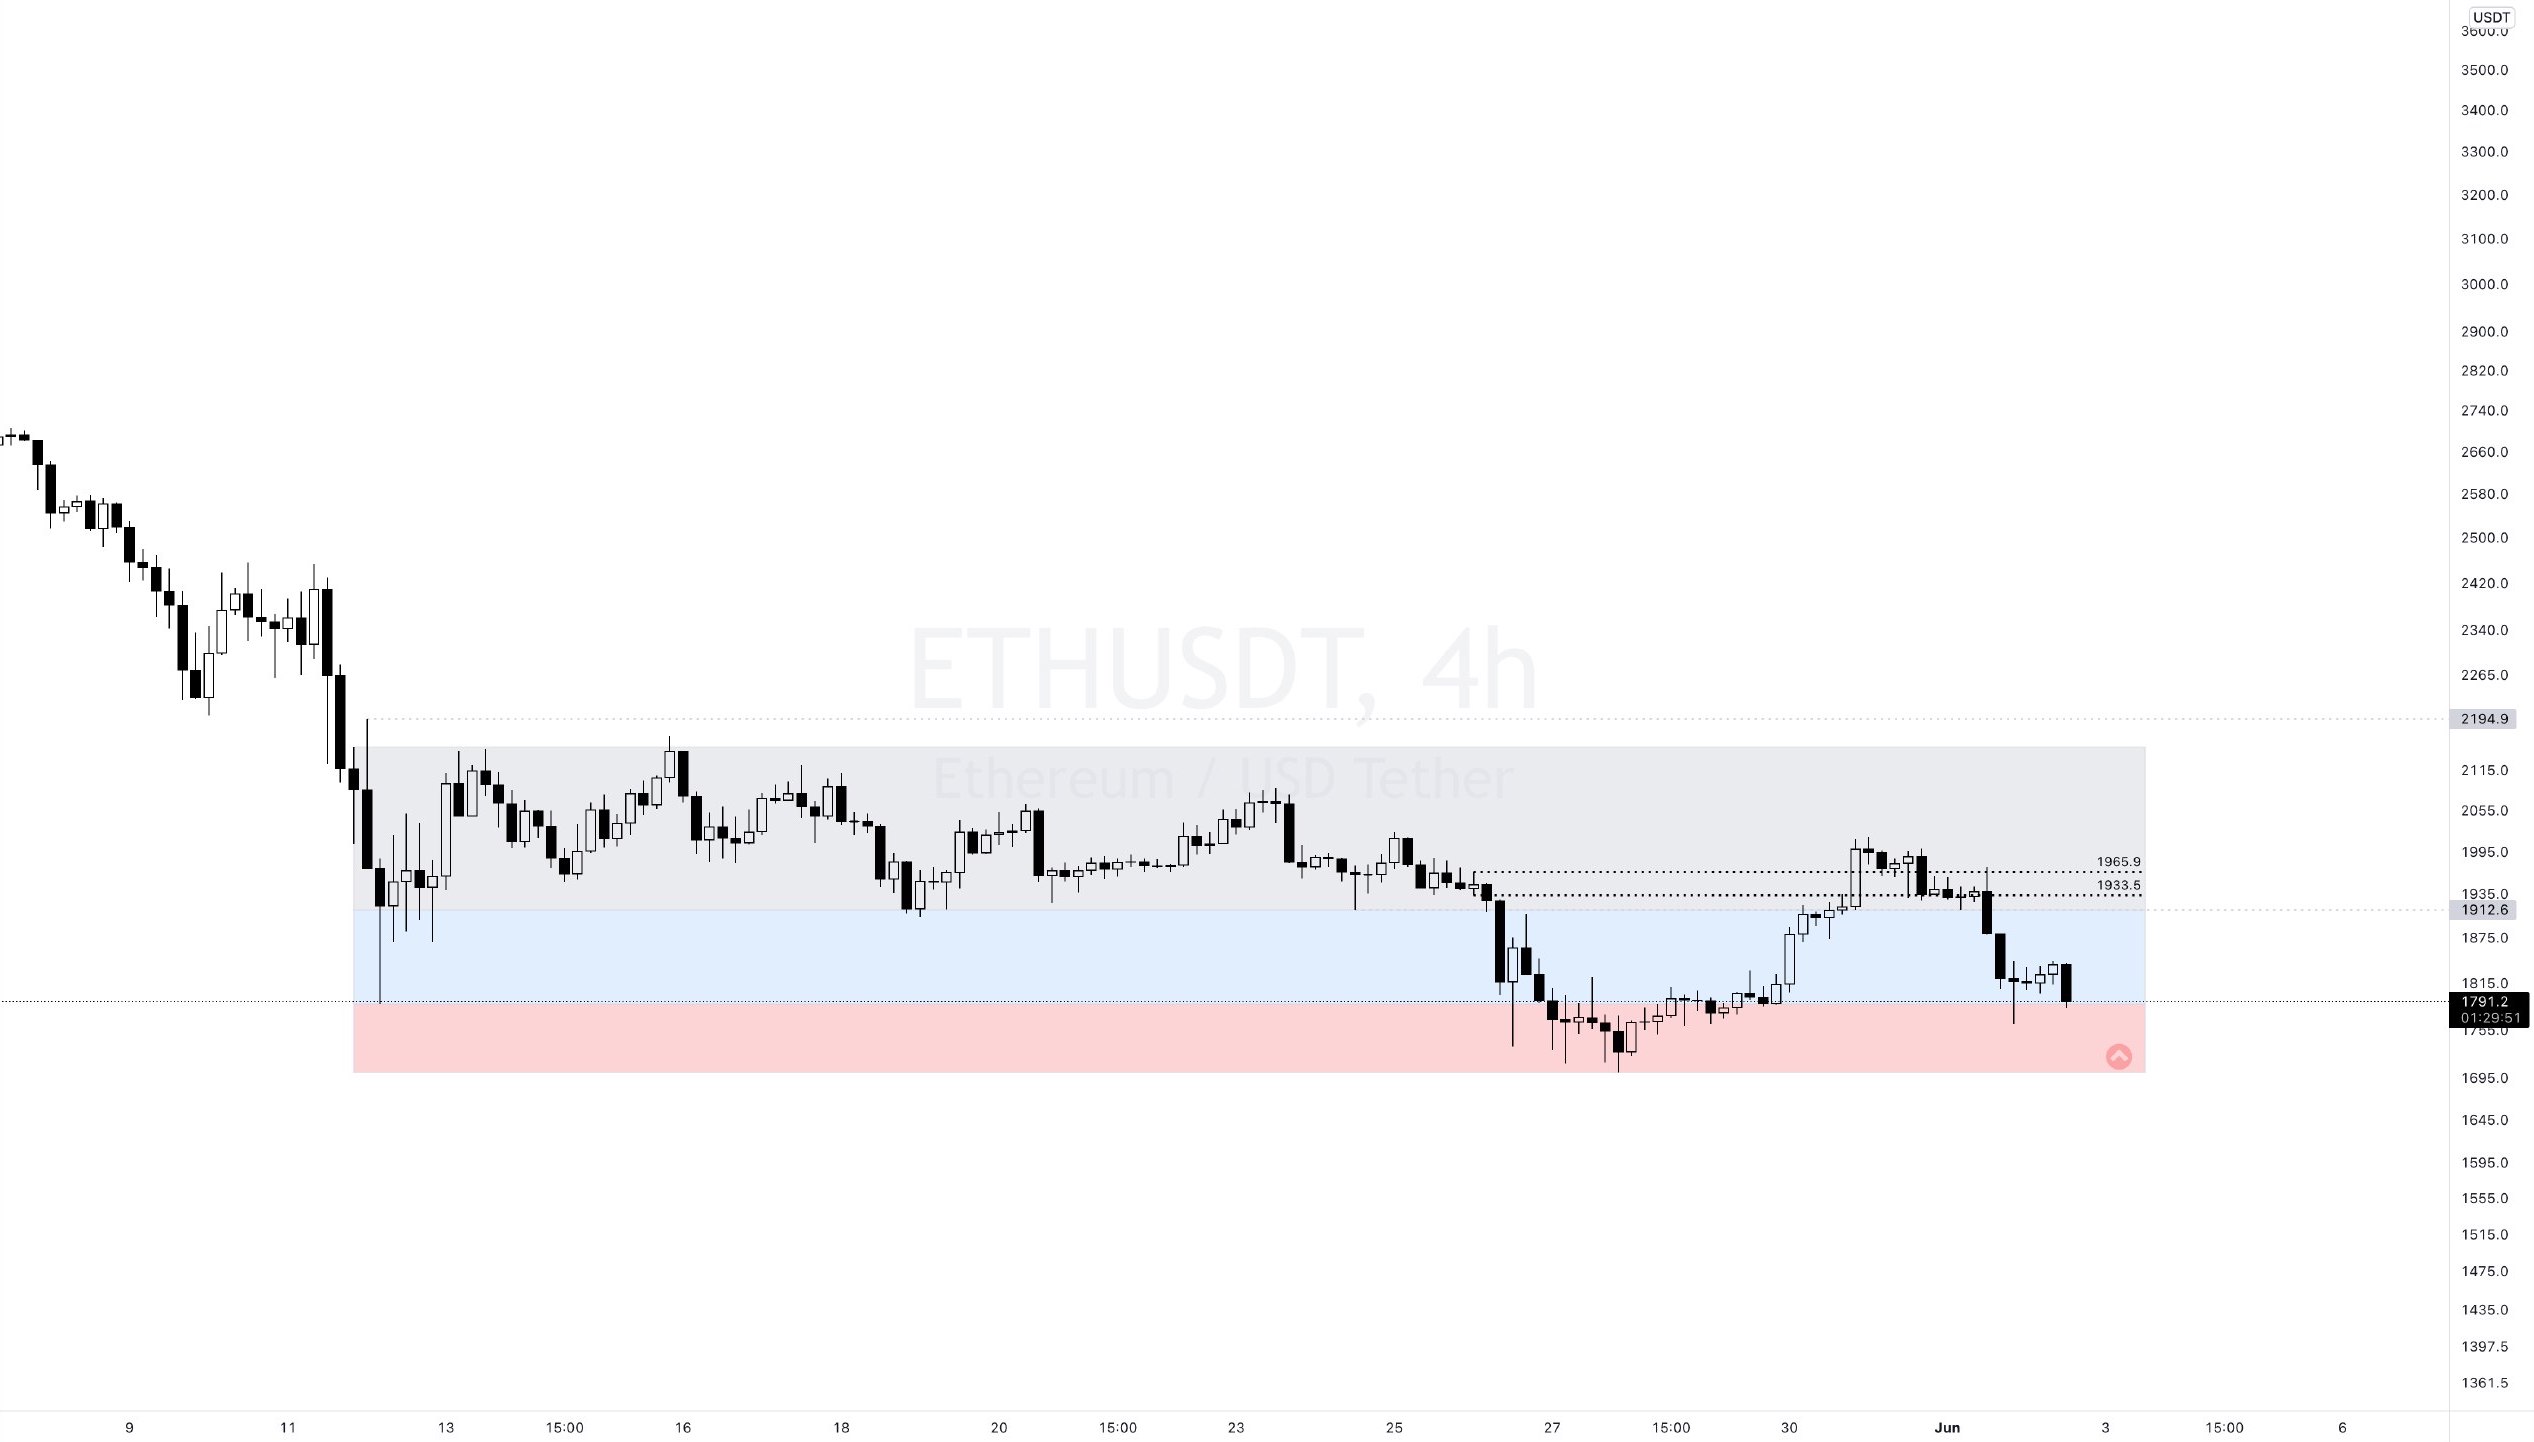
$ETH first targets seen 1822 and 1789 🎯
If the red zone, that is, closes below 1789 on the hourly, starts, then a short trade with the target of 1702, which is the bottom number of the red zone, can be tried. if the target comes, overtake min 50% and leave the rest for a lower needle.
Upward liquidity has just been taken, so short stops are sufficient, around 3% max.

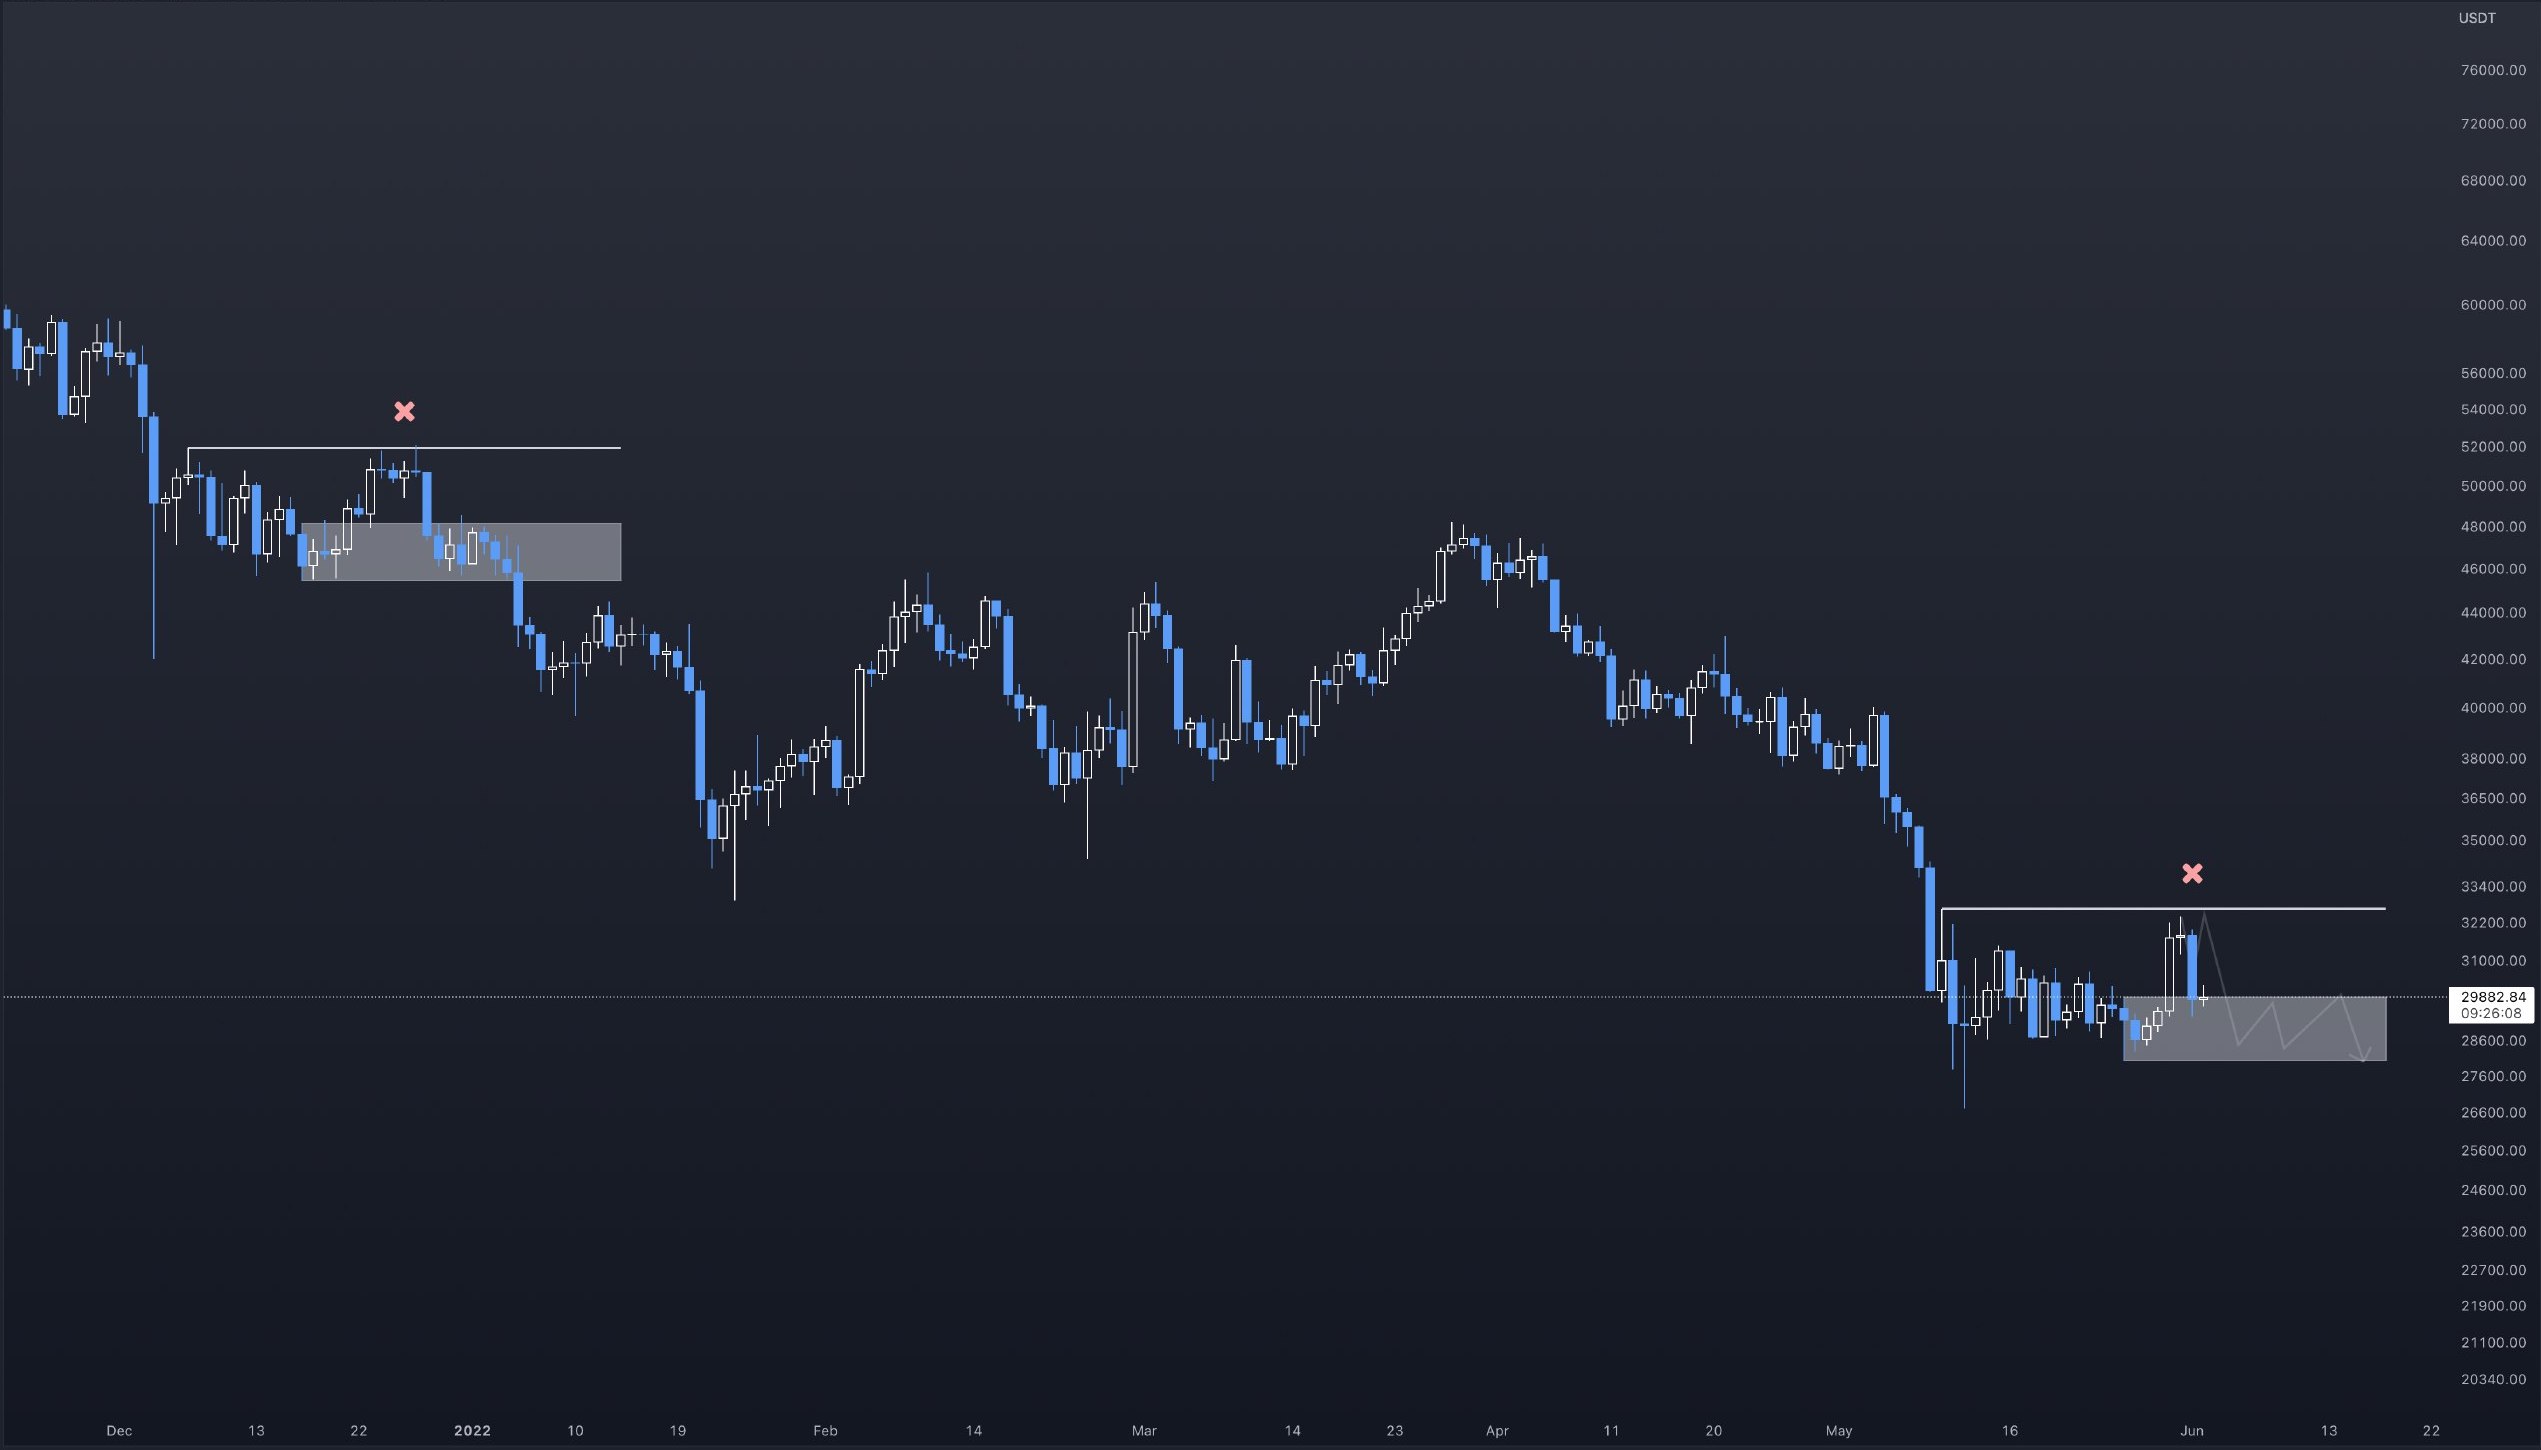
If $BTC turns into a gray box (grey box upper and lower limits: 29886 - 28019), there is a high probability that it will go down to the bottom, but here it is necessary to look at it on a daily basis rather than 1h 4h, so this trade does not belong to today, maybe it can be activated tomorrow.

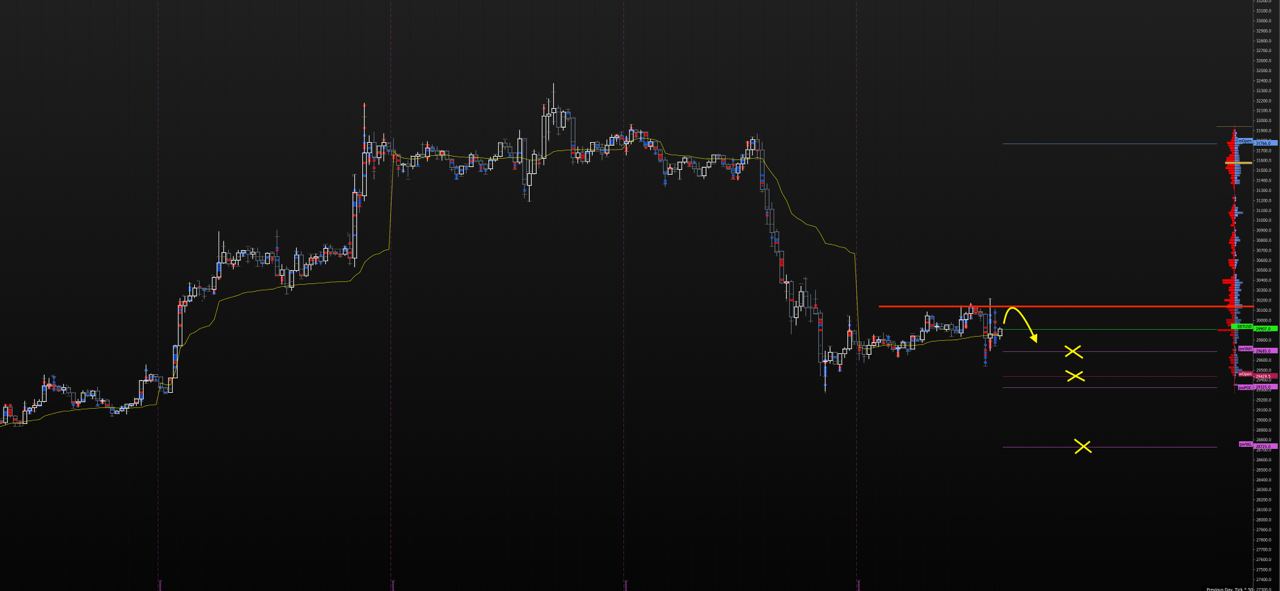
If $BTC fails to close hourly above 30125, we can talk about the risk of another round of decline in the short term.
You can look at 29675 - 29429 and 28725 targets, provided that 30125 is carefully followed and (2-3%) is stopped.
If sequential 30min closures start to come on 30125, you will look at 30632 and 31237, I am at the screen (I find the long side less likely, but if I will not be at the computer in the future, if the direction of travel changes to upwards, even for a short time, you should also consider this.
Good luck with,
It is not investment advice.
Graph Source: Tradingview
Posted Using LeoFinance Beta