1 June My Technical Analysis
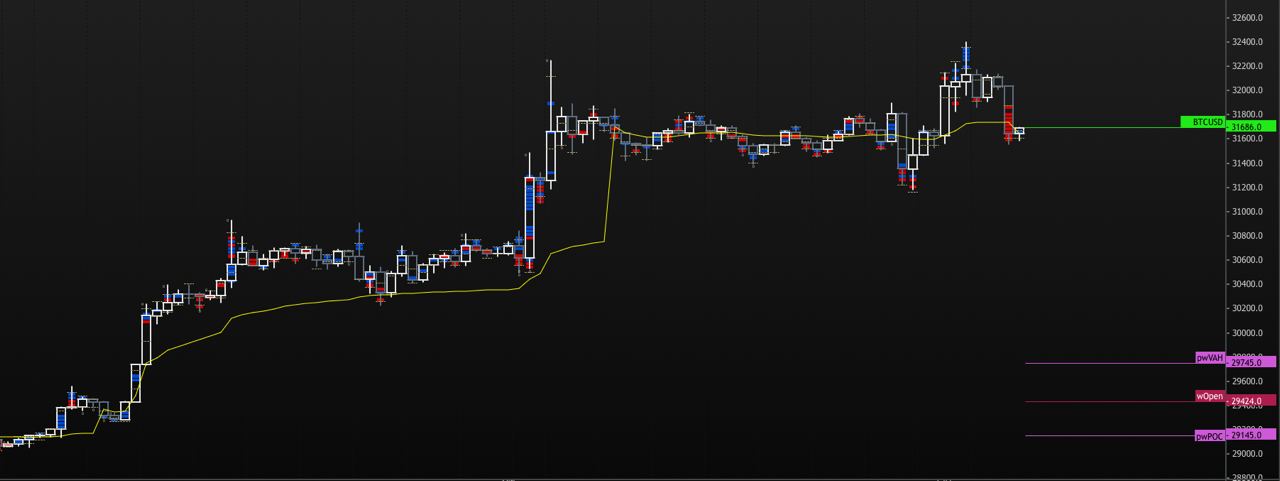
My bearish expectation for BTC continues. Testing the bottoms again is among my expectations, but I'm not in a hurry to get it right away. First of all, I would like to see the weakness.
Bear market rallies are very fast and brutal, so even though I know that the probability of a decline is very high, it will be a little difficult to locate. For this reason, I will try to share critical figures frequently. In this process, there may be a little crowd of numbers.
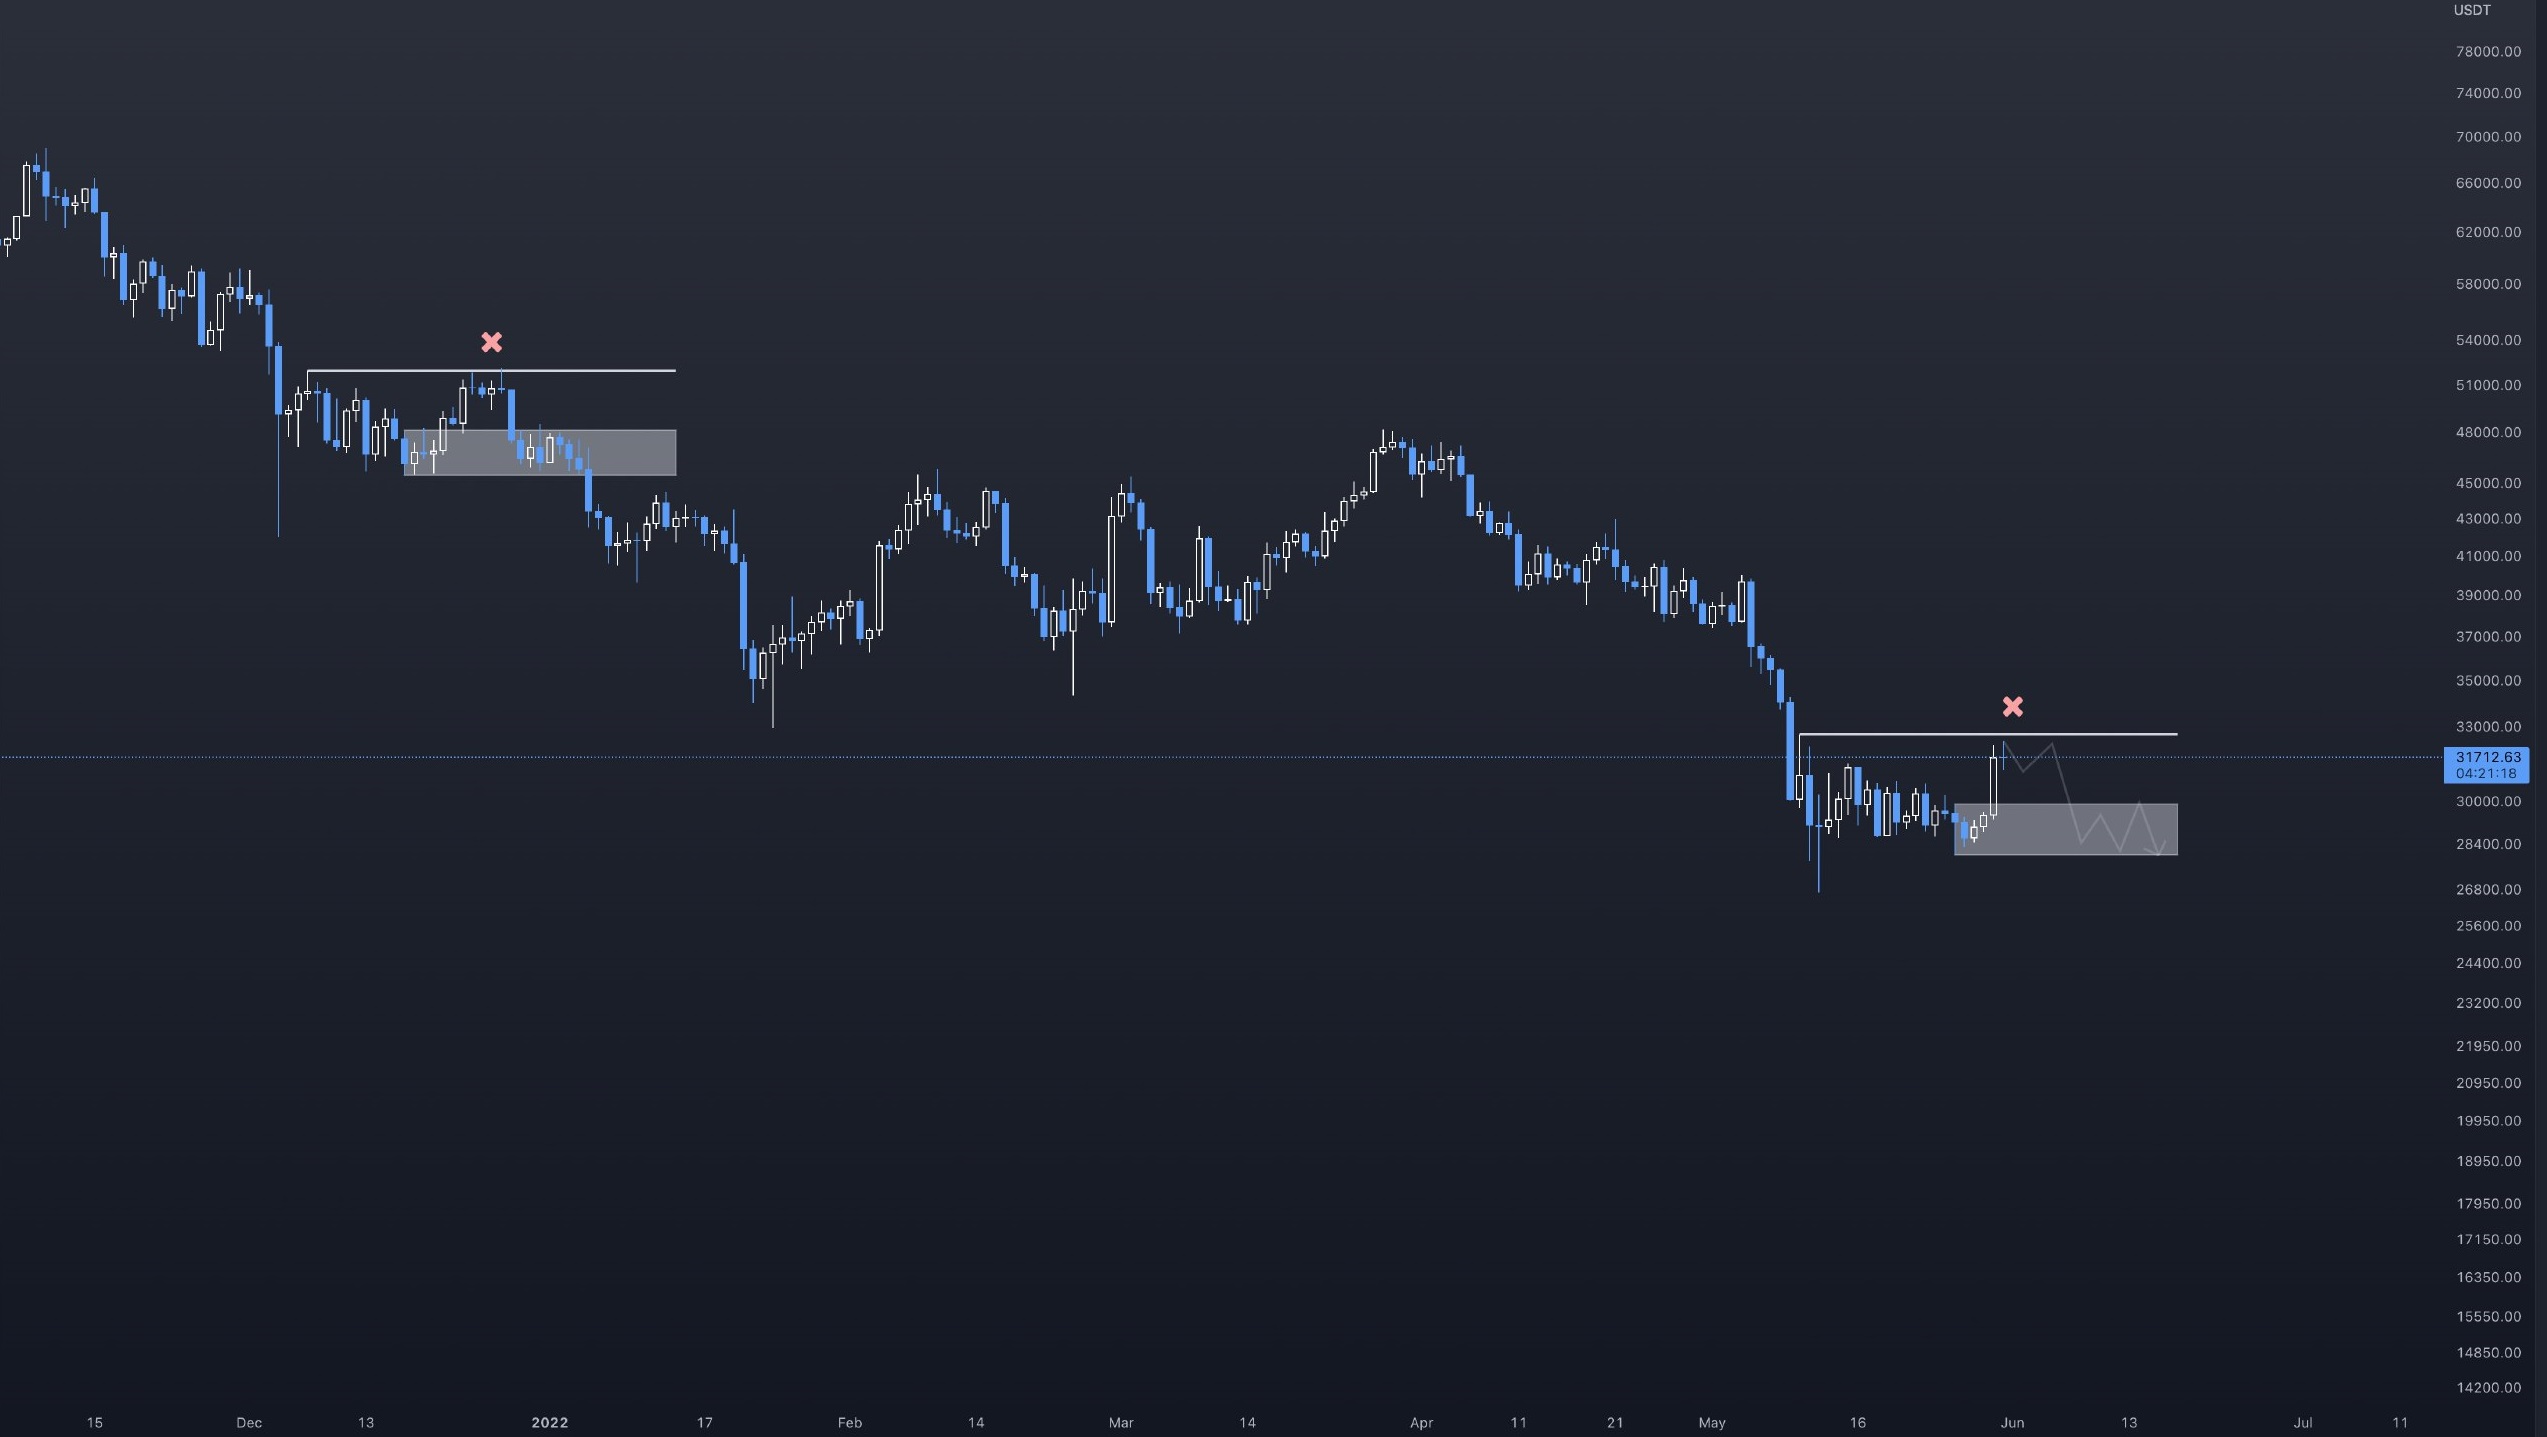
Let's pay attention to the $BTC 32.6 resistance, there is also a nice fractal here.
If the similarity rate to the past is not exceeded / if there is no closing on it for 4 hours, this may be the first high where the decline can be triggered.
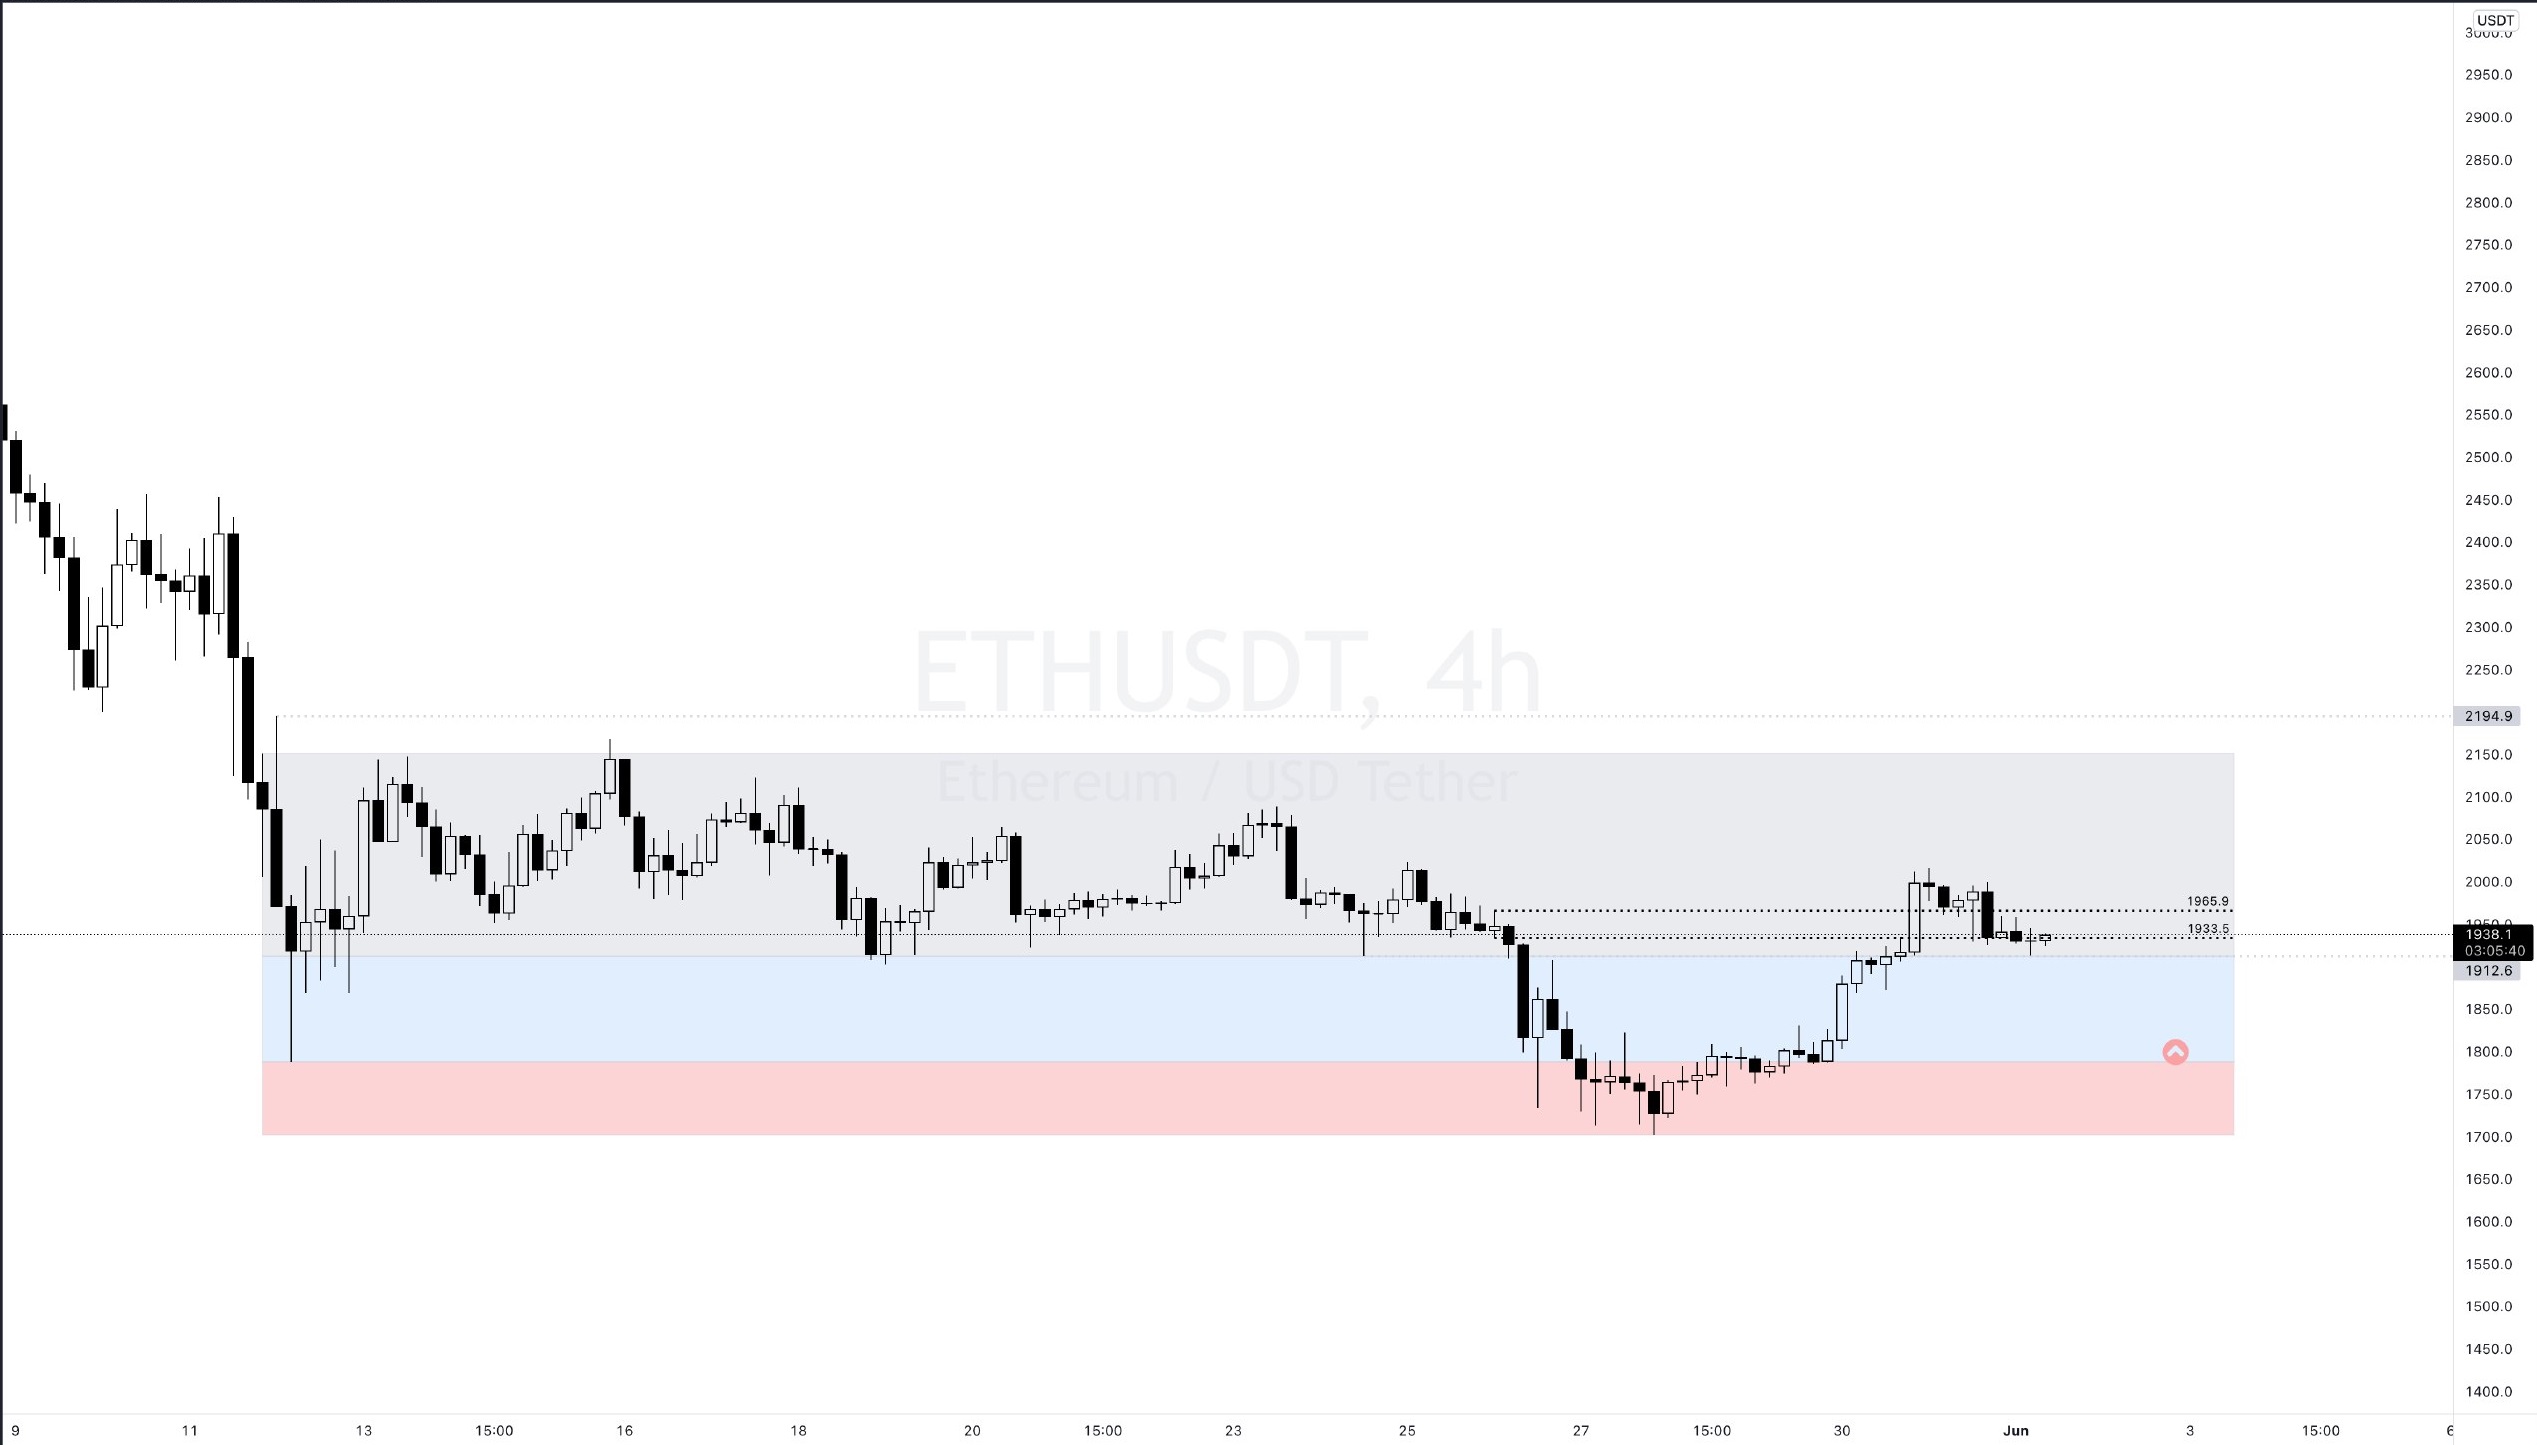
1912 significant support on $ETH side. Let's see how it went below 1965 and 1933, respectively, with the sales that started yesterday evening and how these areas move in the intermediate supports. If closures start under 1912, this time the lower limits of the blue zone will open.
If it can hold above 1965 again, then the gray zone upper limits can be targeted.
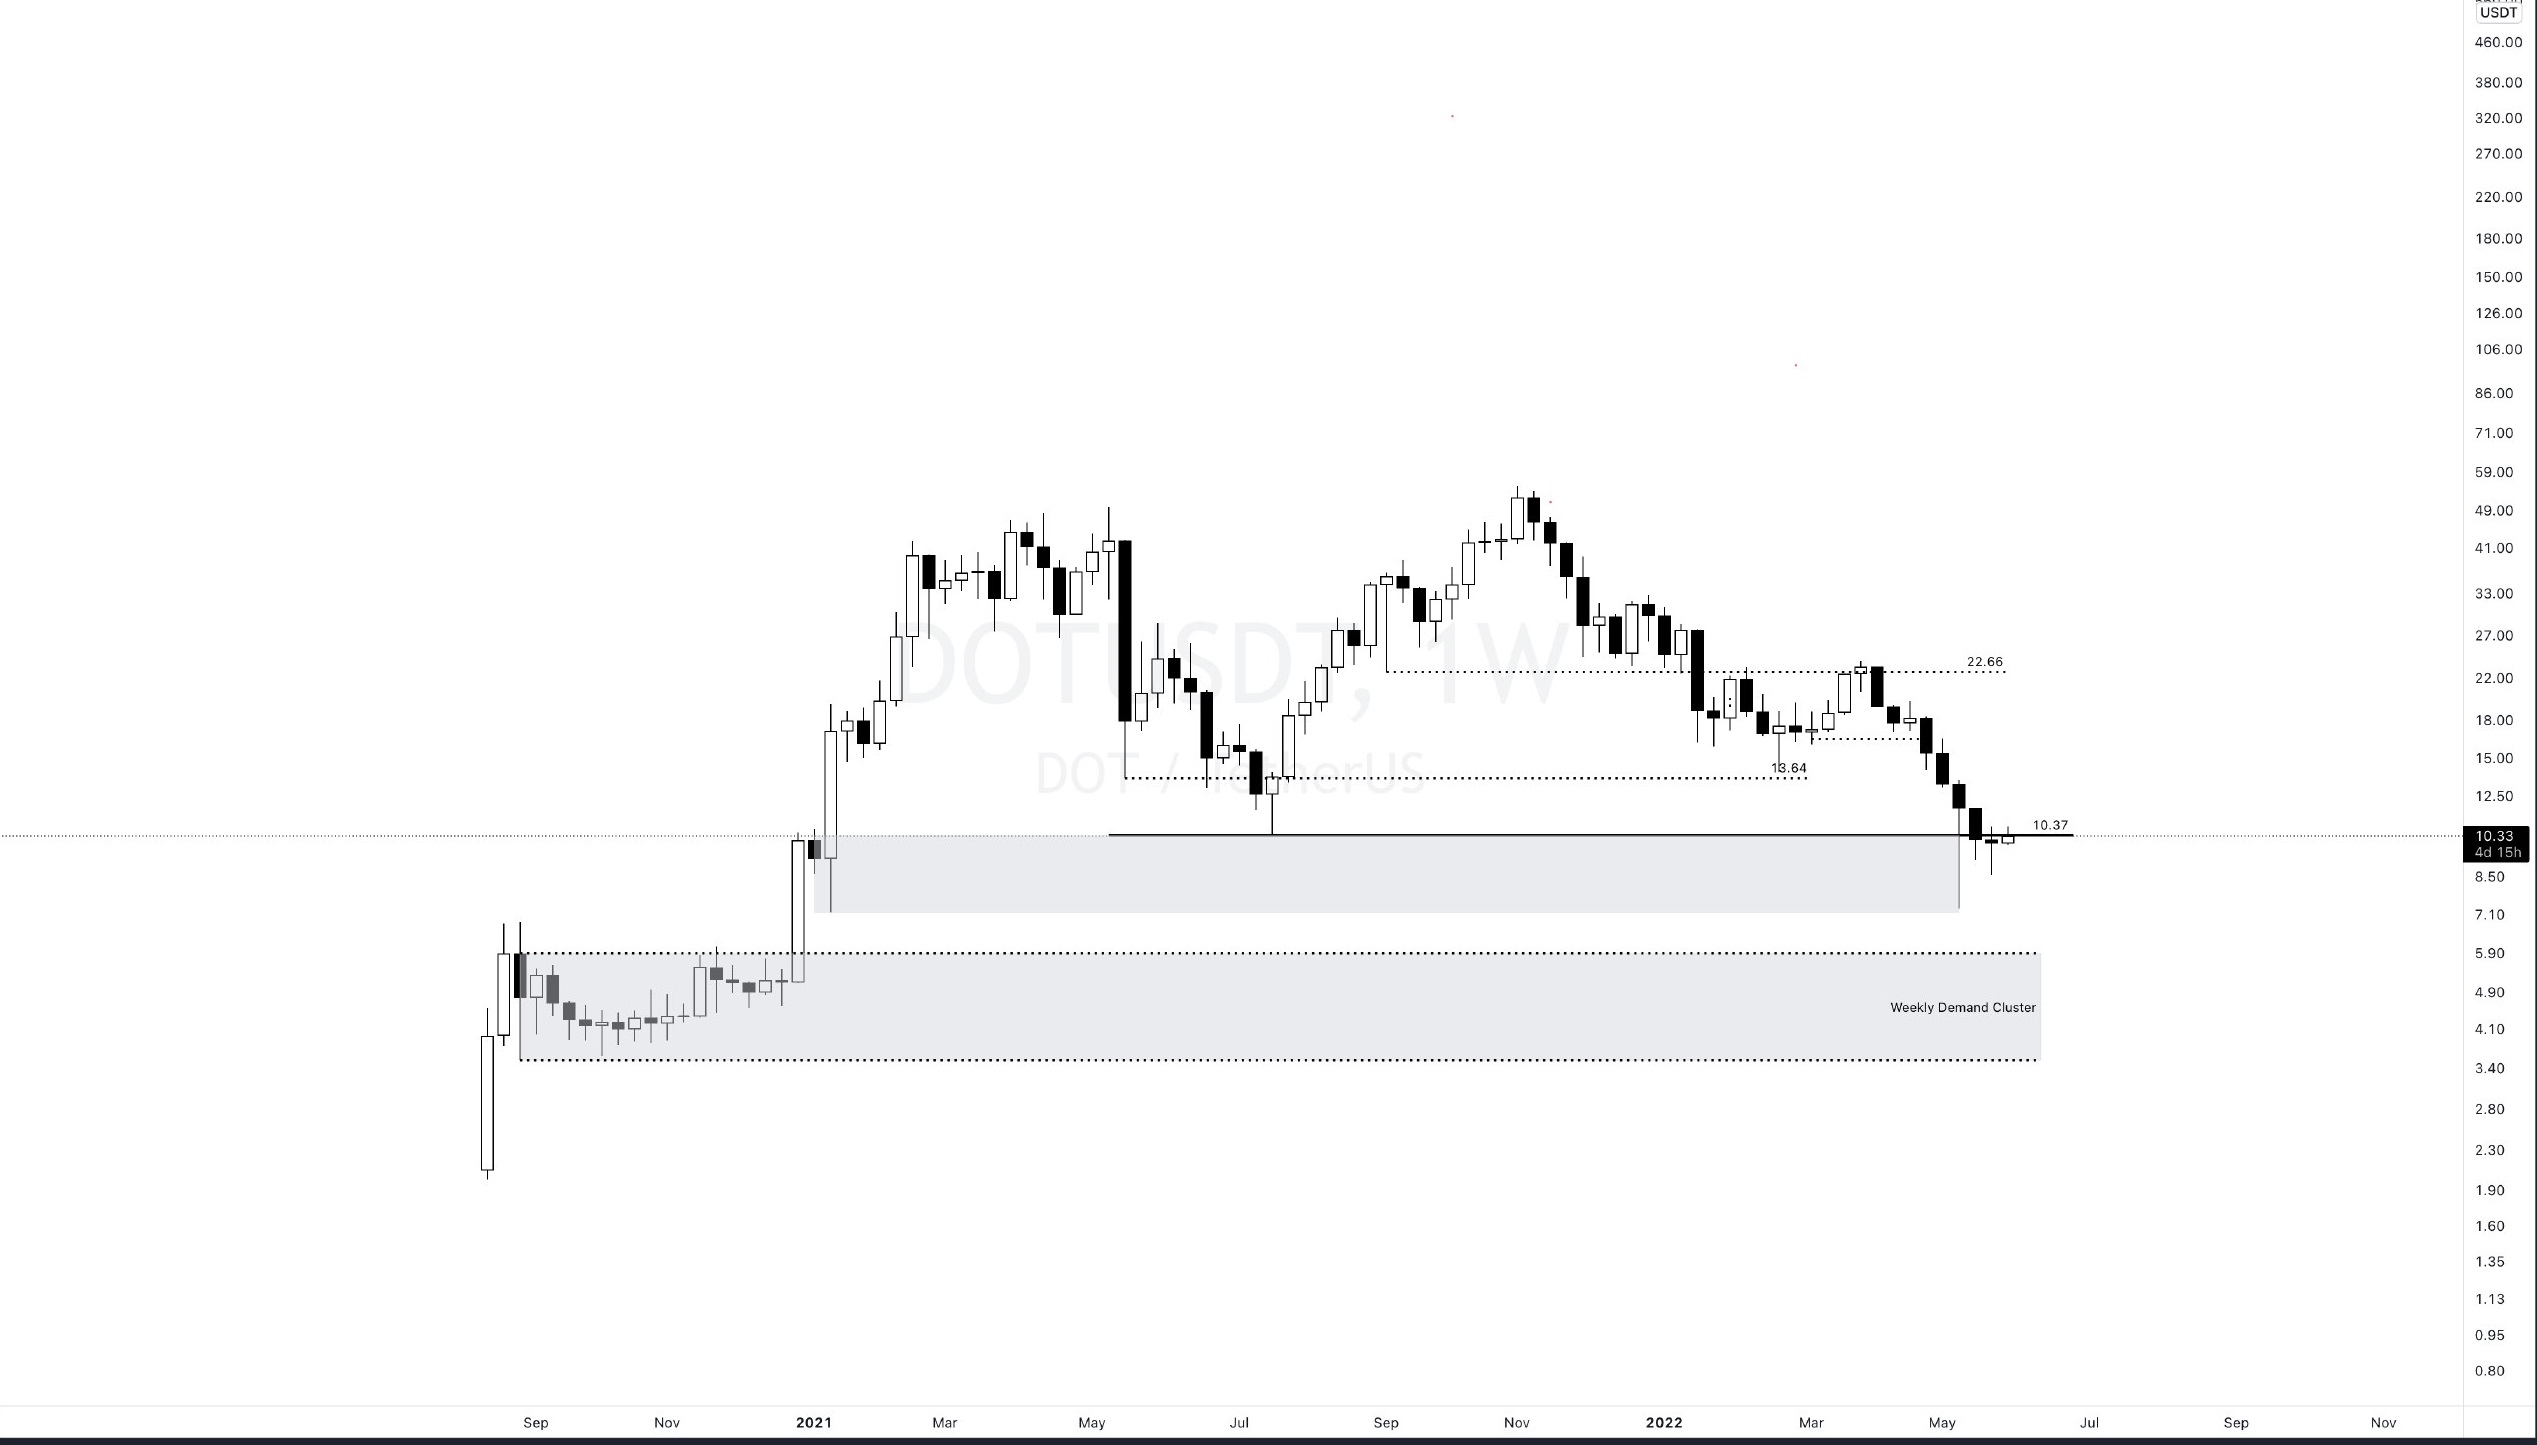
$DOT 10.37 is currently acting as resistance and the big bearish structure formed at 54 and 10 USD may also bring us to 13,647/16.38 weekly close above the neckline, but the outlook is more bearish retest at the moment.
Therefore, as long as it is below 10.37 and the weekly closing continues, 7.30 and 5.89 can be seen with a stop on it. In the weekly close above it, we can see acceleration towards 13.64 and 16.38.
As the prices of altcoins fall, the movements are small, but the rates are large. Therefore, in this process, the amounts you trade in altcoins should be low and the risks should be less. It is useful to focus on the trade of the majors $BTC $ETH.
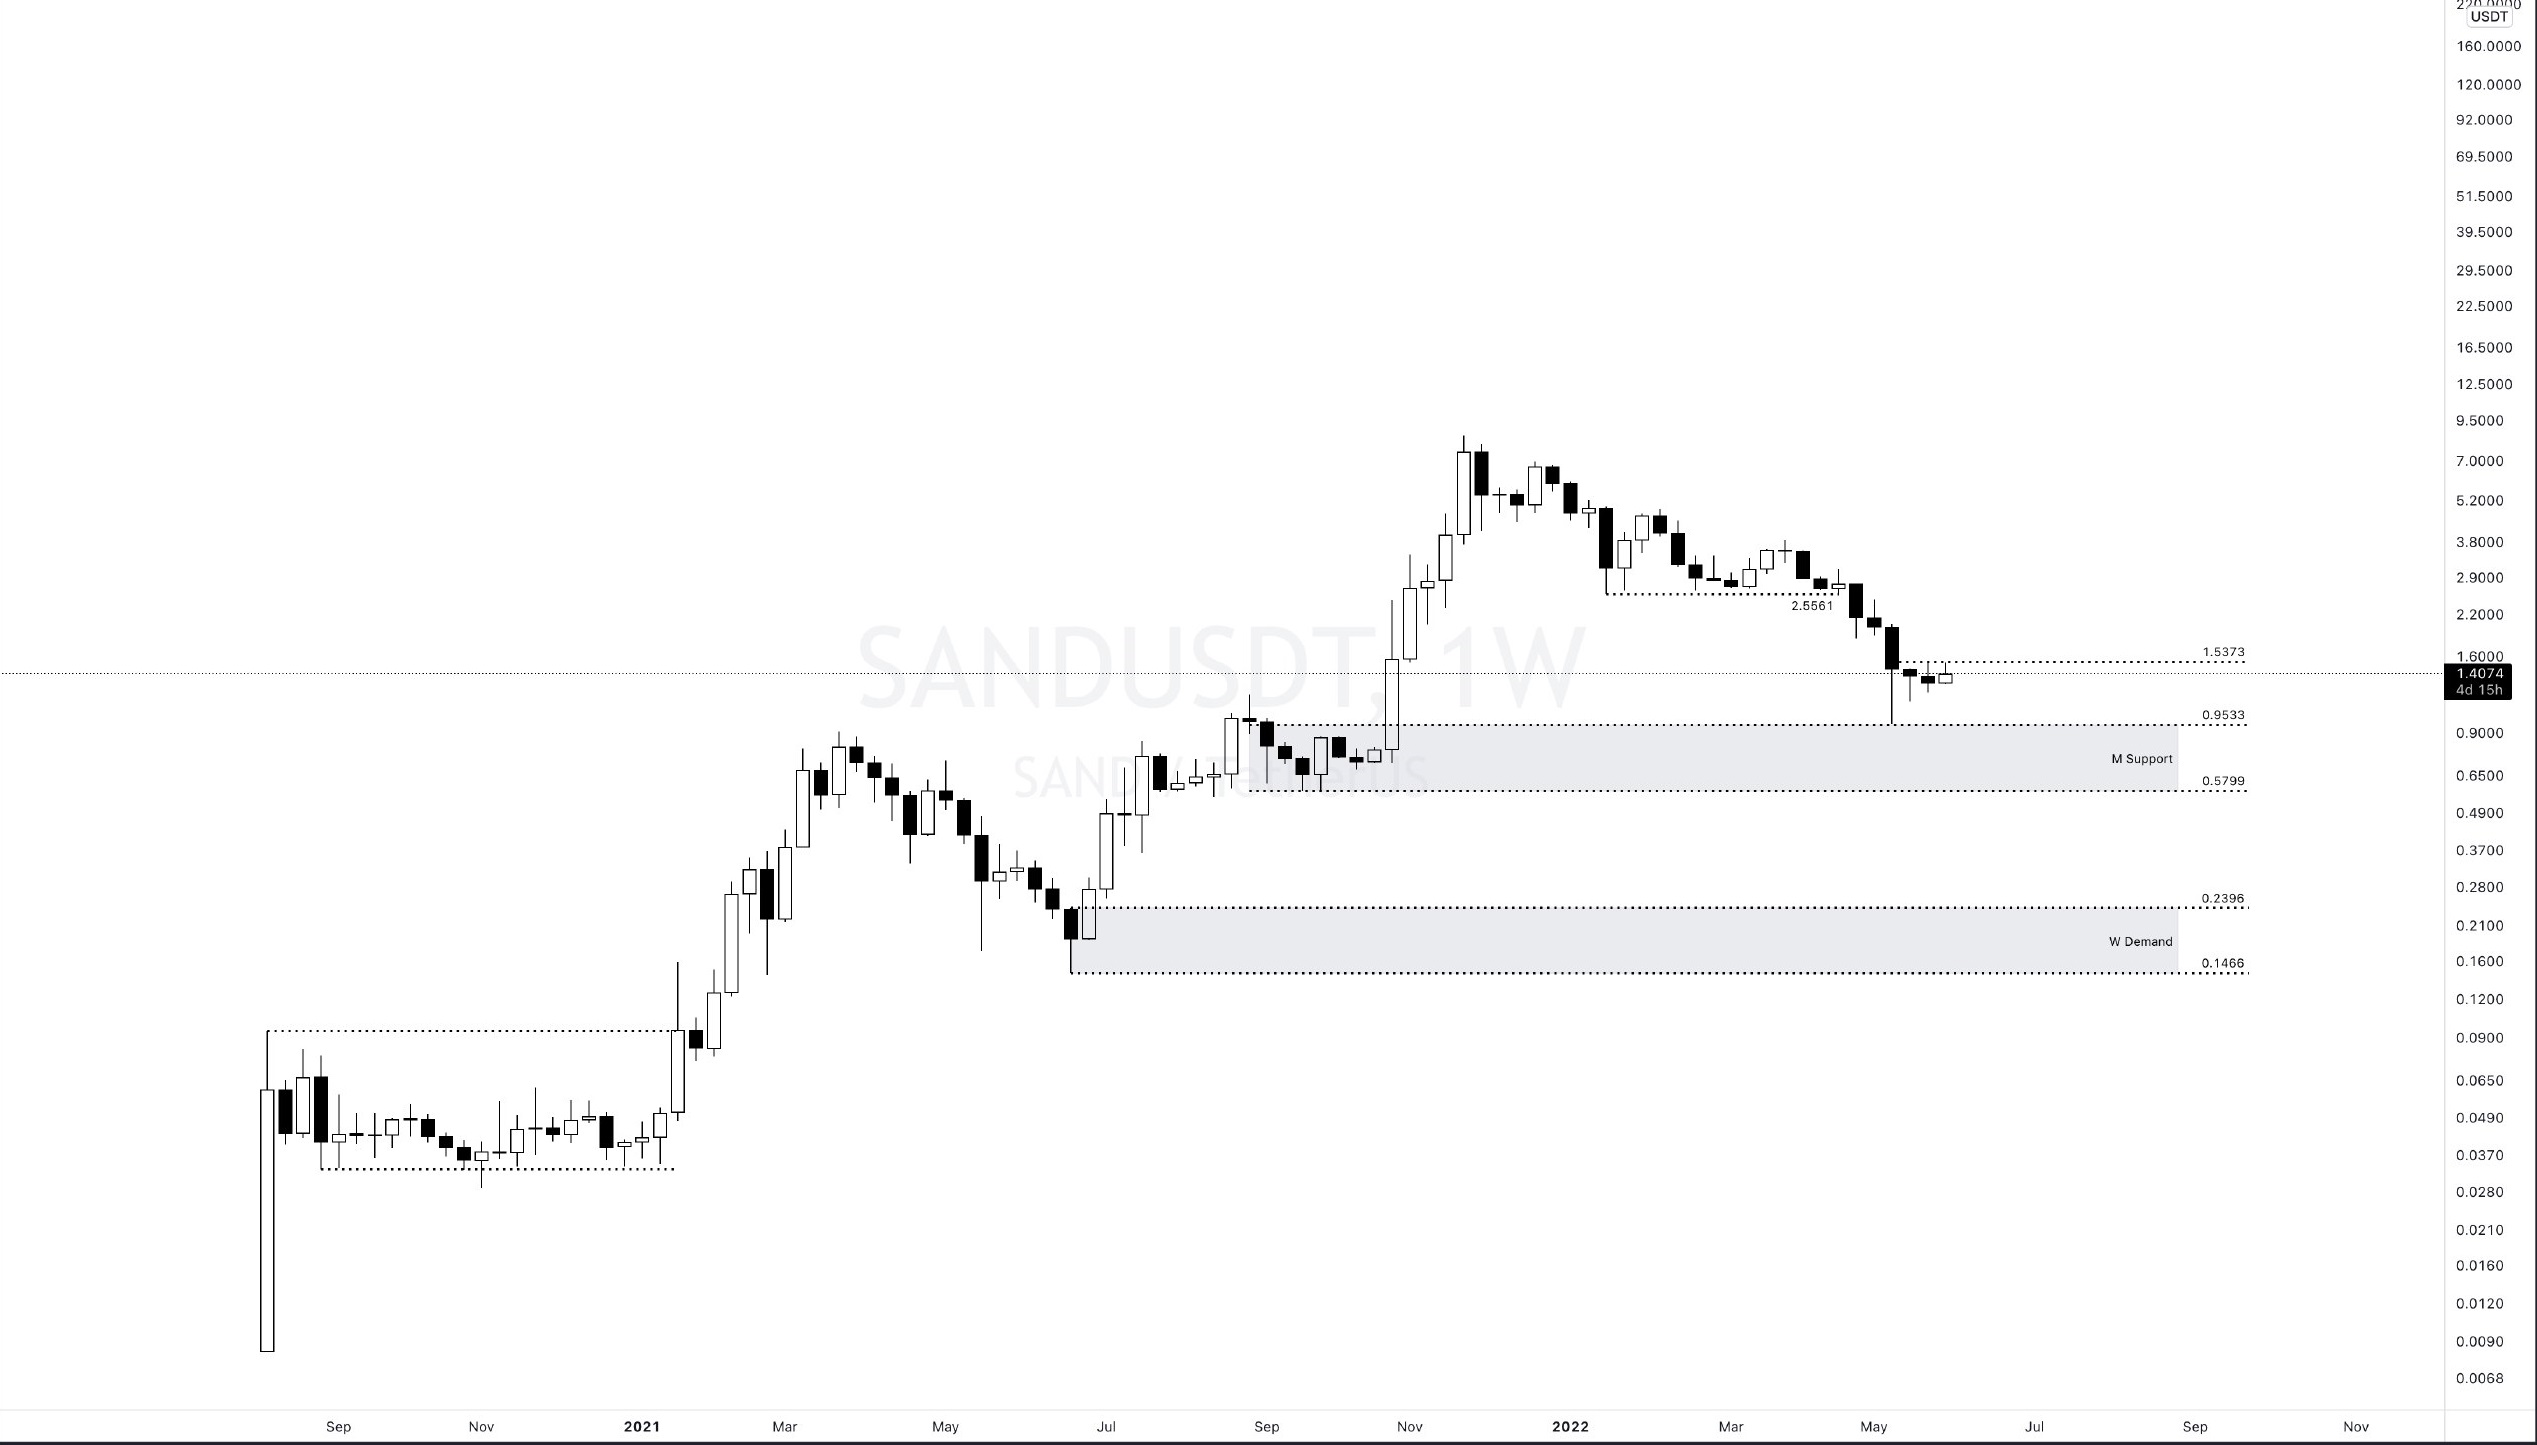
If $SAND closes weekly above 1.53, 2.55 can be targeted, but if it closes as it is, 0.95 and 0.57 will be the next bearish targets.
As the prices of altcoins fall, the movements are small, but the rates are large. Therefore, in this process, the amounts you trade in altcoins should be low and the risks should be less. It is useful to focus on the trade of the majors $BTC $ETH.
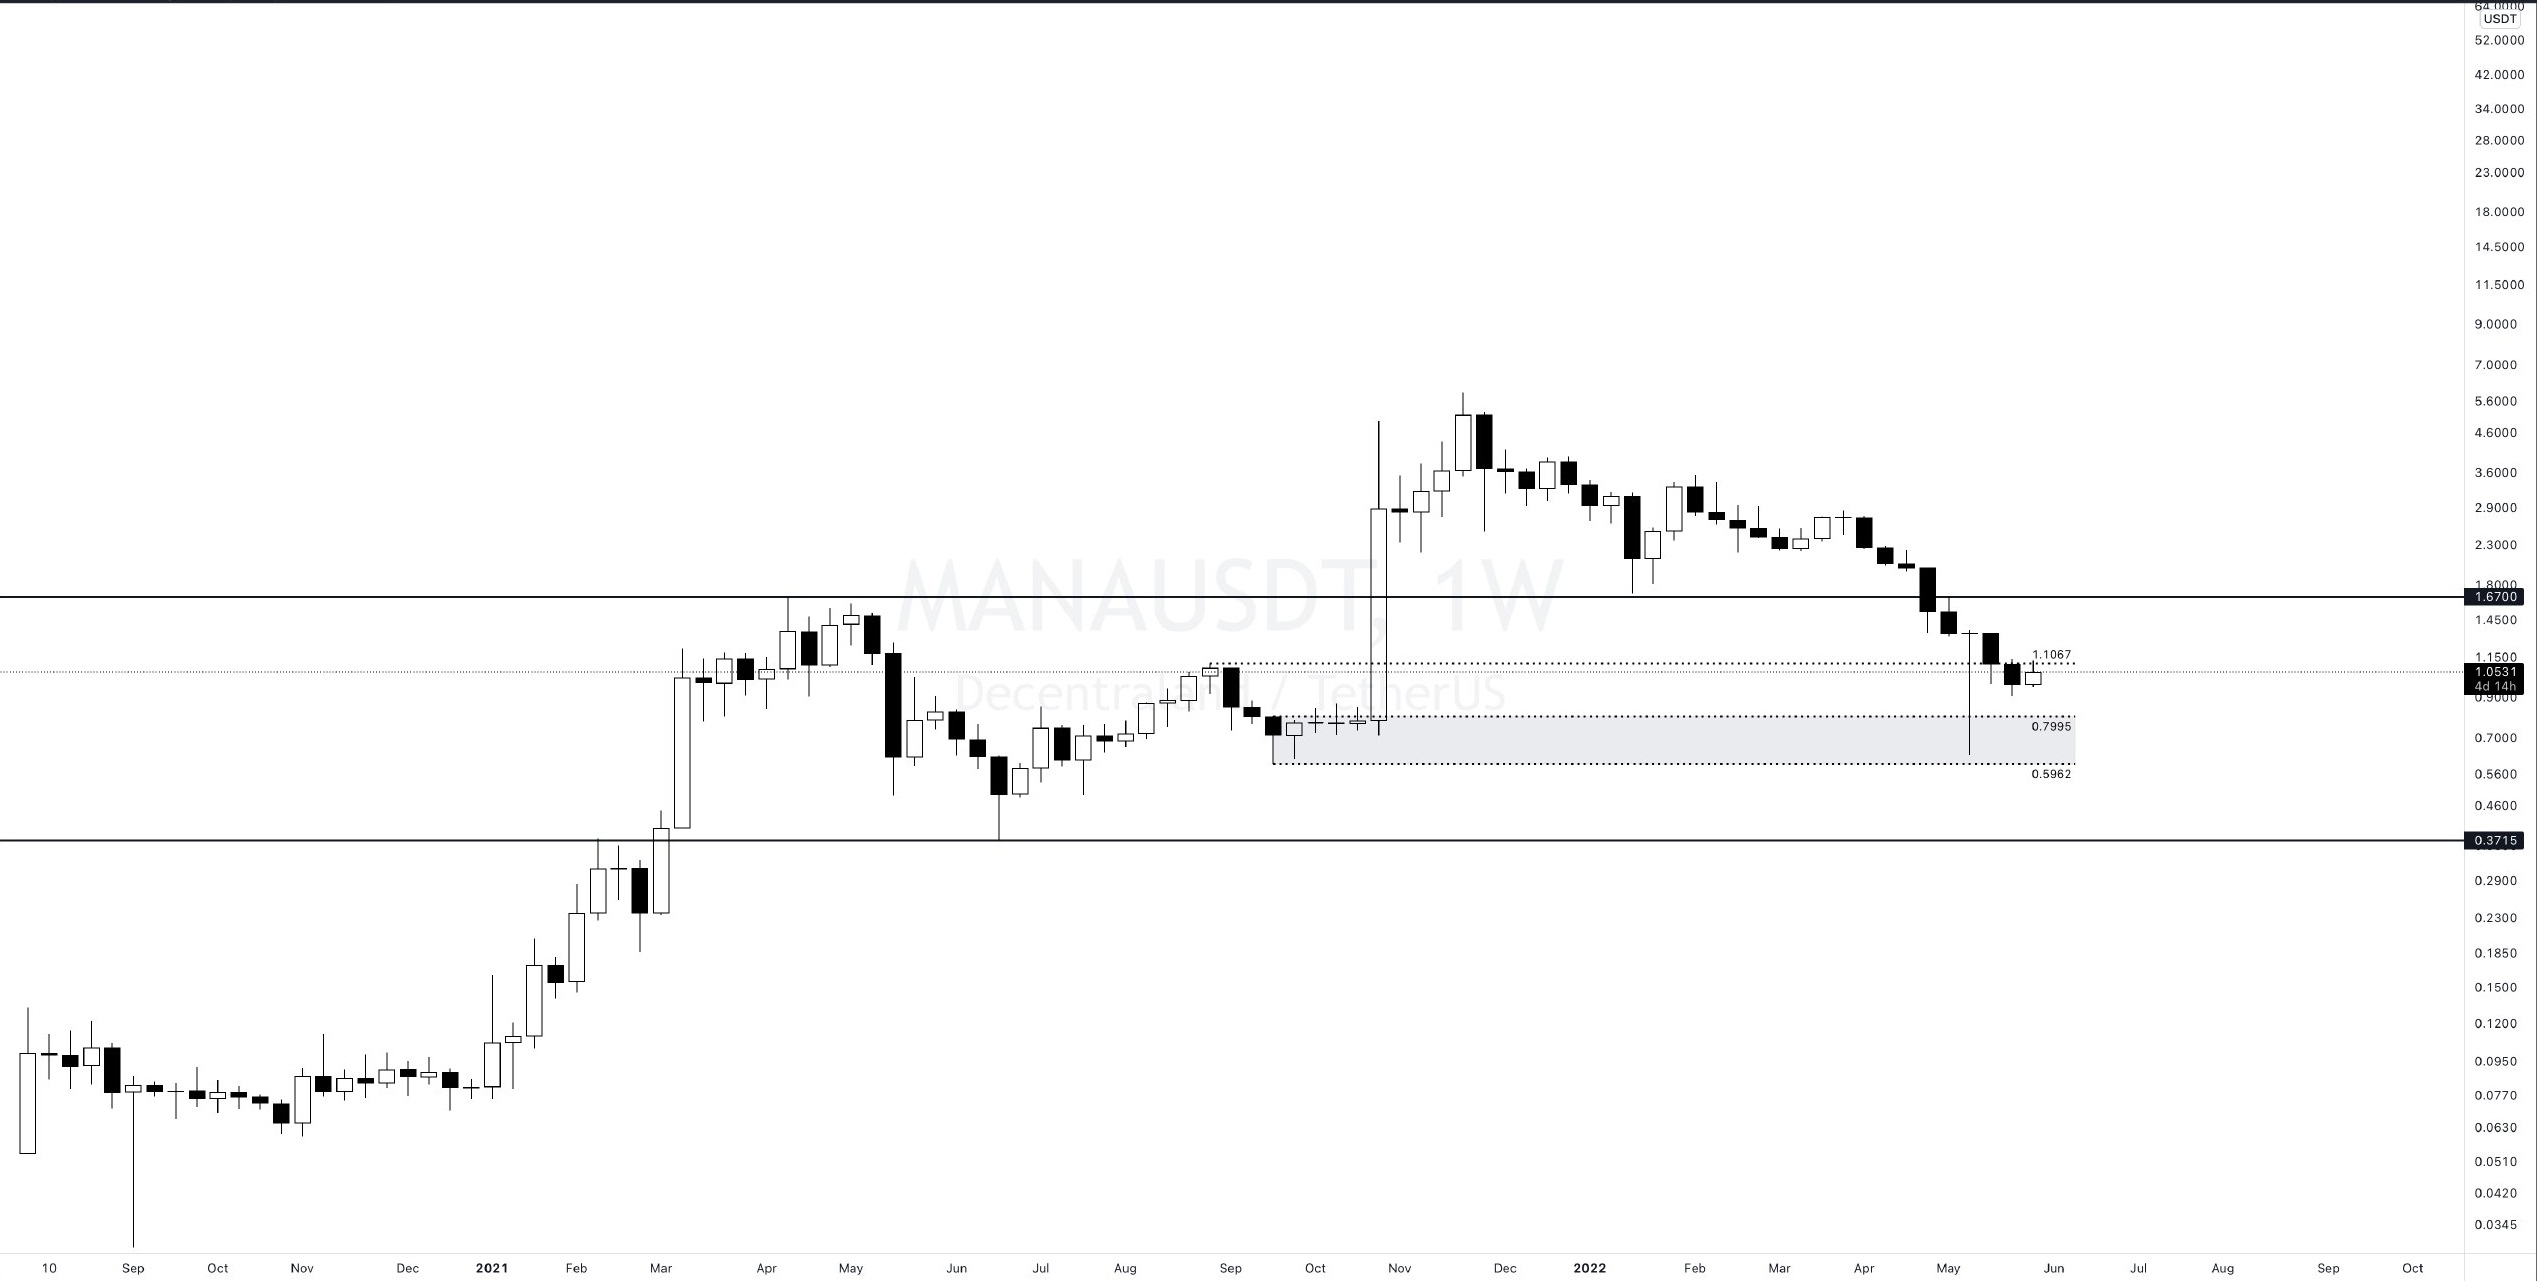
The needle coming towards $MANA 0.60 has created a local bottom, but it is not enough for a general bottom formation. 0.59s are highly likely to be revisited. If we can get a weekly close above 1.1, we can look at 1.33 and 1.67. Below 1.10 and if the closings continue like this, 0.79 and 0.59 and 0.37 in the following months should be on the radar.
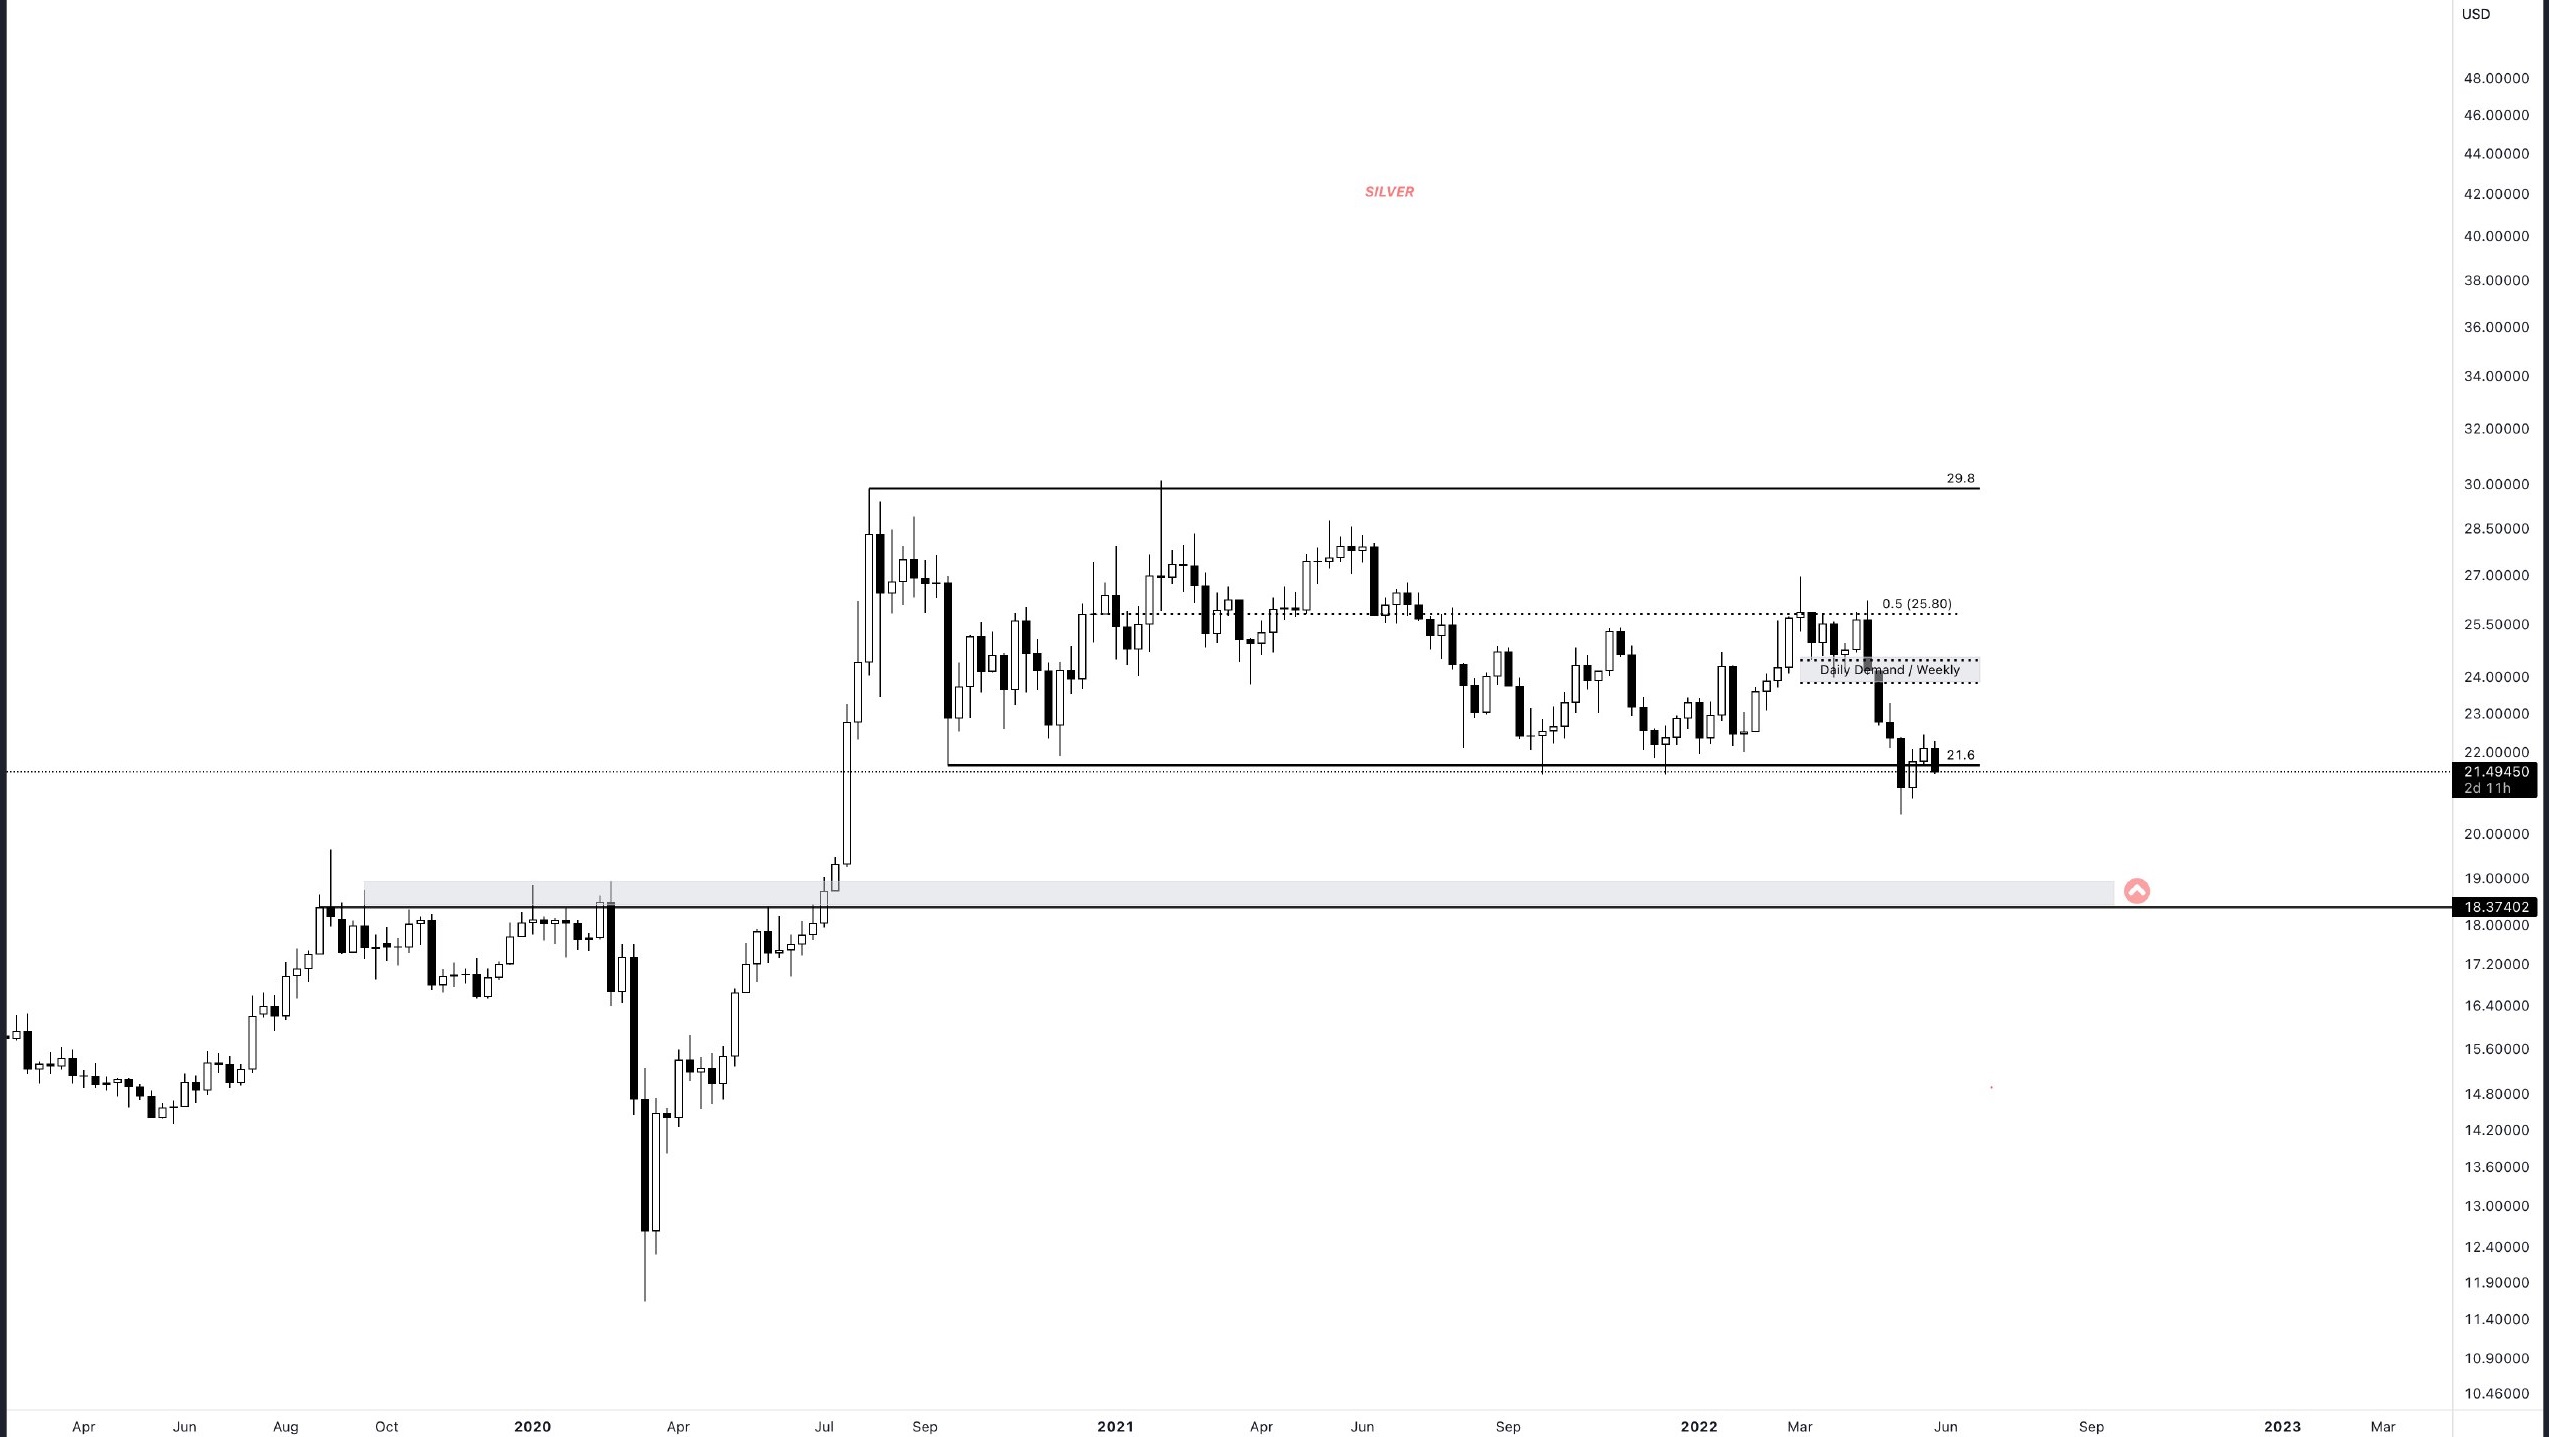
A very important level of 21.6 for silver has been closed below this level in the past weeks and it was very unsettling, and after correcting it, it is subject to selling again this week. Frankly, I look at 18.37 - 19 USD with a close below 21.6 again and try to be a buyer from here. If you think 21.6 short 19 USD, you can follow the trade with 23 stops.
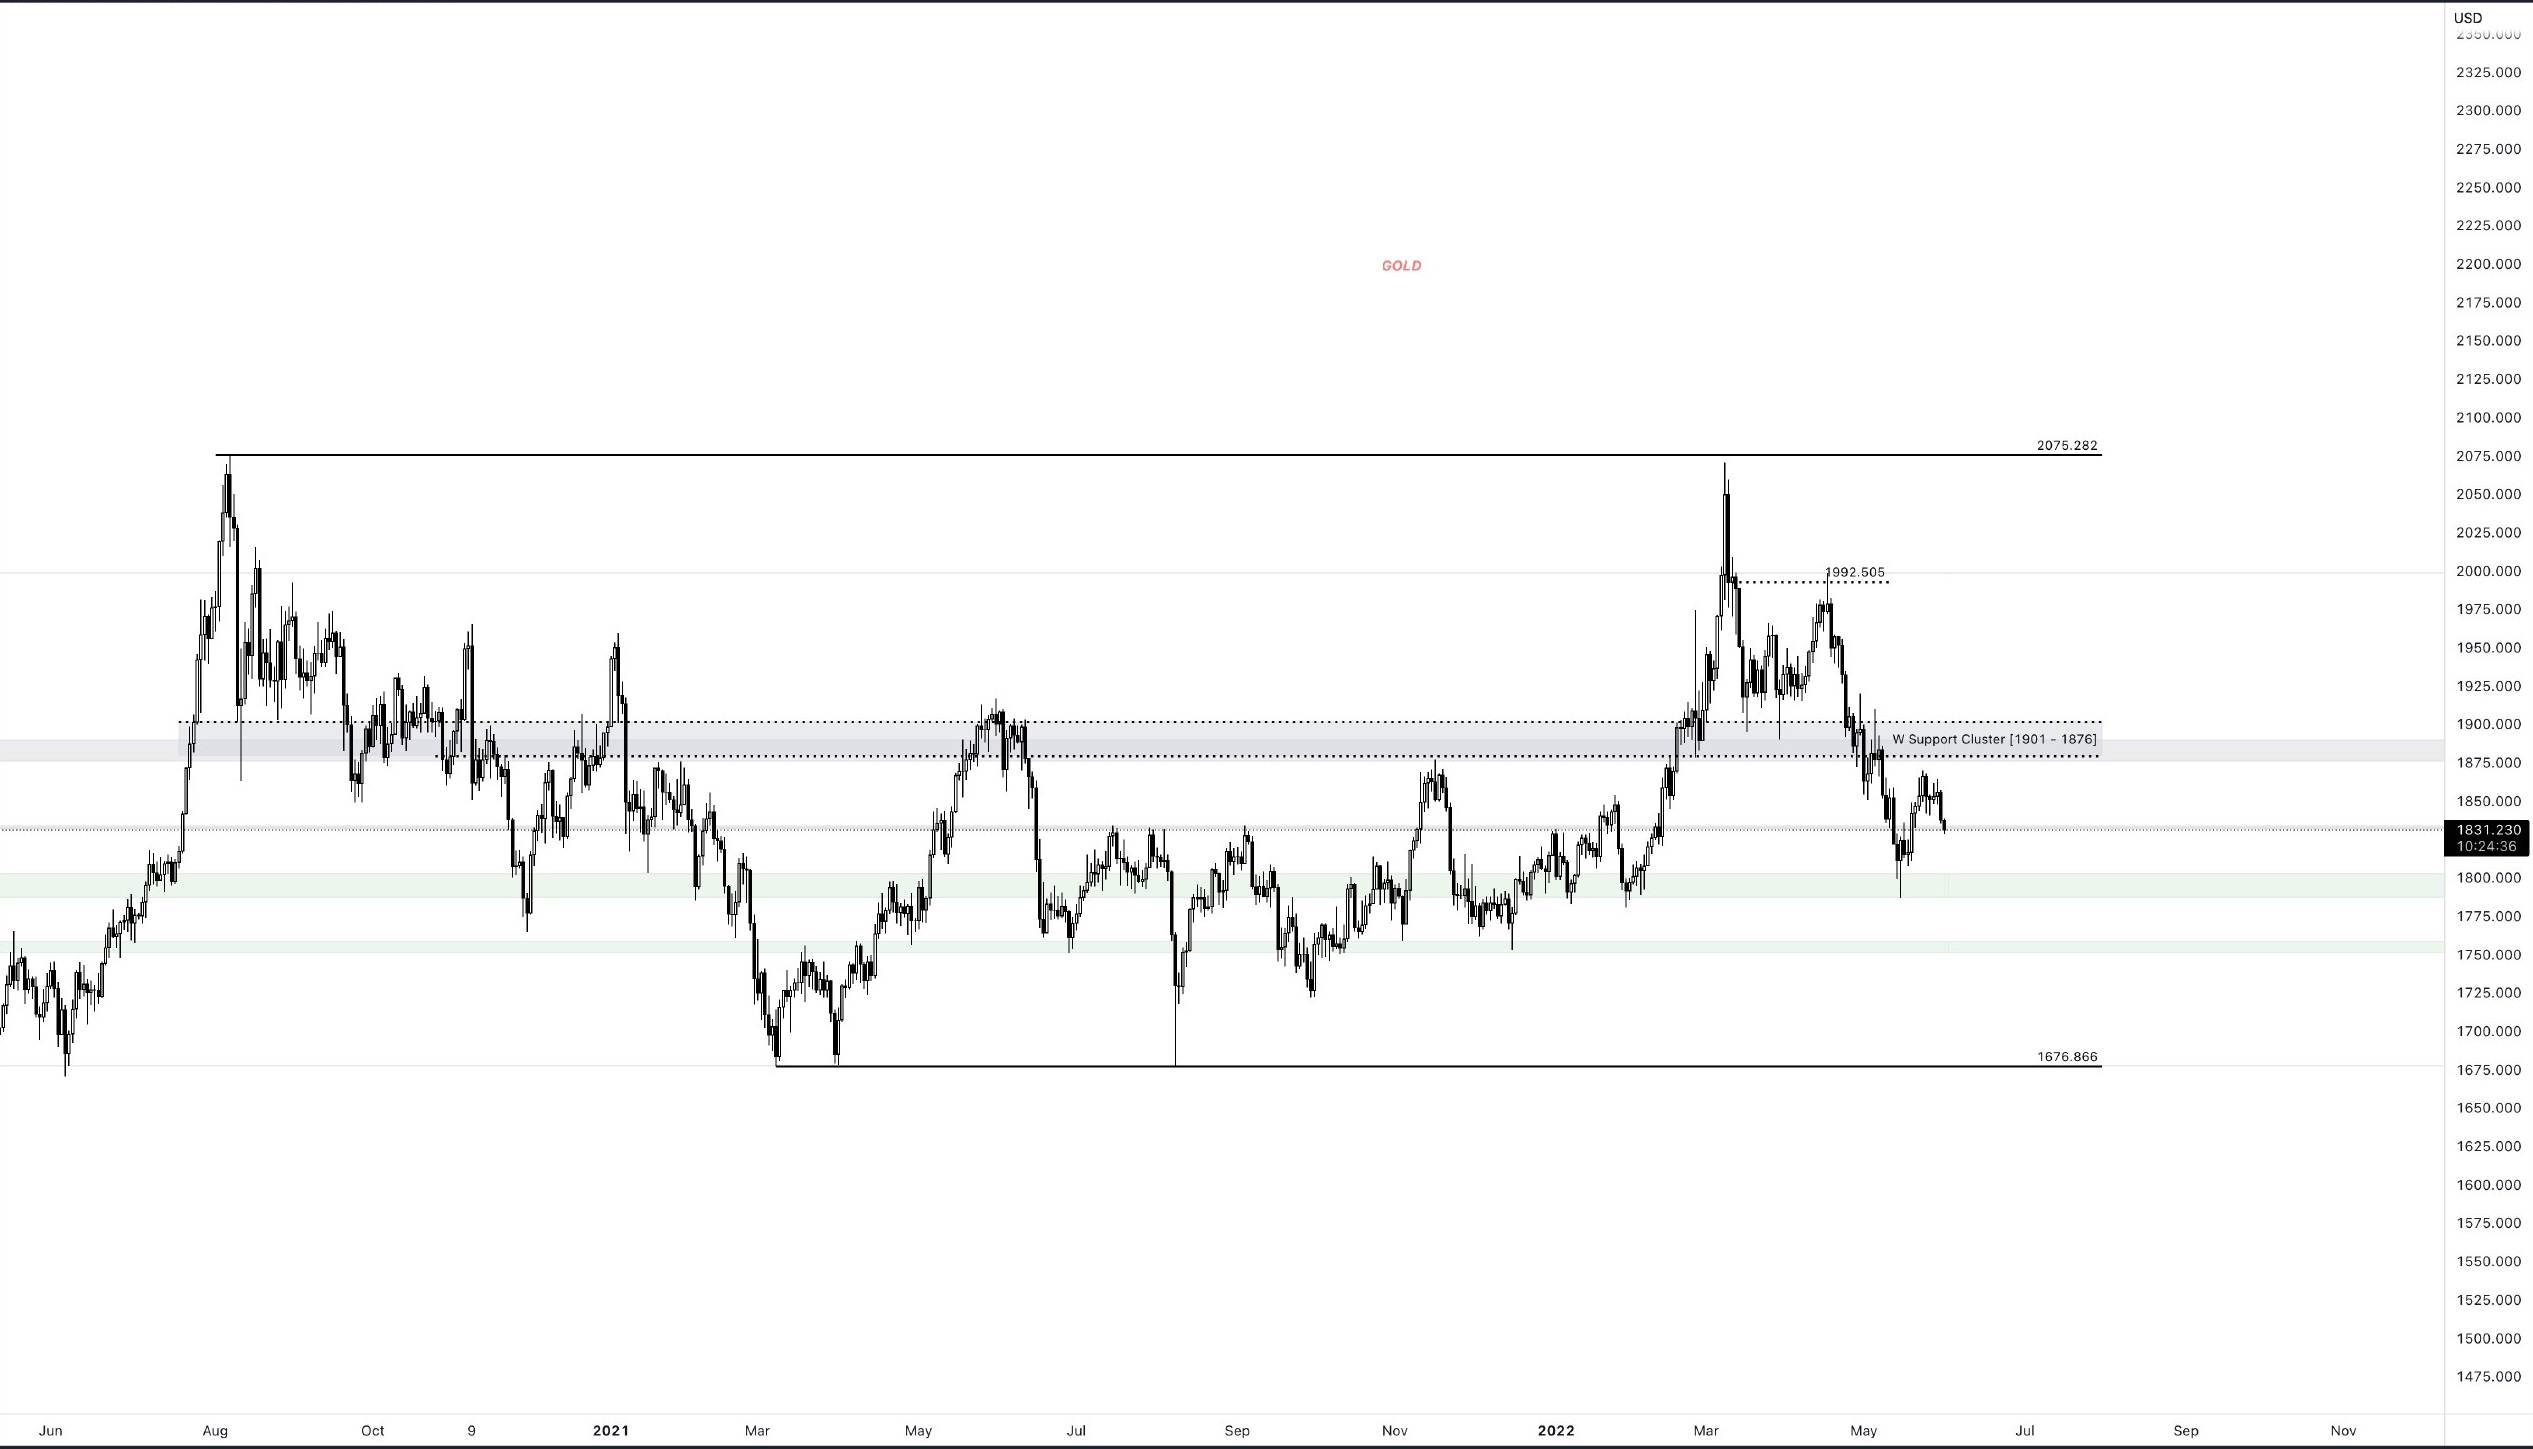
For gold, long-term long positions can be taken over 1901-1876, but there is uncertainty at the point where it is now. Today, with the movement of DXY, some retracement is observed. It is possible to decrease until around 1803 - 1786, if there is a reaction from here, it can try again 1868.
Good luck with,
It is not investment advice.
Graph Source: Tradingview
Posted Using LeoFinance Beta