We Are Yet To See The Huge Bitcoin Pump.
You might be wondering why I named my post "We Are Yet To See The Bitcoin Pump" when we are currently experiencing a bearish trend after bitcoin hit its All Time High at $69k then started correcting after a huge bearish divergence formed after the Bitcoin price broke below the $63k support and resistance level. In the short term, Bitcoin is in a bearish trend but the long term trend still shows Bitcoin is bullish and would recover soon.
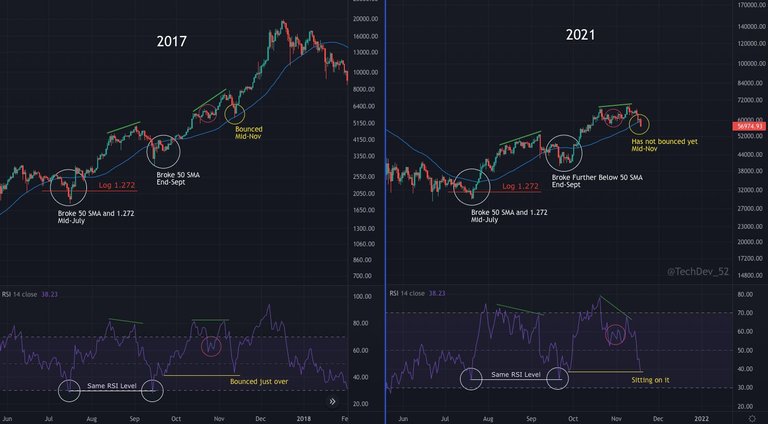
Now comparing the 2017 chart and the current 2021 chart of bitcoin you will find so many similarities that indicate that Bitcoin is not done pumping, it is correcting now to gain more momentum to pump forward.
In 2017 Bitcoin made a low in September and then pumped after then started to correct on November 9th, this year 2021 Bitcoin and the market suffered huge dips in September and in October, the market recovered which formed the low in September just like in 2017, then November 10th bitcoin price hit a new all time high at $69k and it started correcting almost exactly as 2017 but missed by one day, which is not much and still accurate to me.
Let me use the relative strength index (RSI) to forward more prove my point on the Bitcoin pump coming, RSI is a technical indicator used as additional confirmation when analyzing the financial and crypto chart. Look at the 2017 bitcoin chart, Bitcoin broke the 50 SMA (Standard moving average) forming a baseline on the RSI which price bounced off when price broke the 50 SMA at the end of September and formed another baseline (the yellow line shown in the chart above) on the RSI indicator mid November.
The same thing happened in 2021, and right now Bitcoin prices is sitting on the yellow line shown in the chart above, which is based off on the 2017 Bitcoin chart, which shows that bitcoin price is about to pump like crazy once history repeats itself
I'm still credibly bullish on Bitcoin long term but am still taking precautions on my short term trades.

Posted Using LeoFinance Beta
