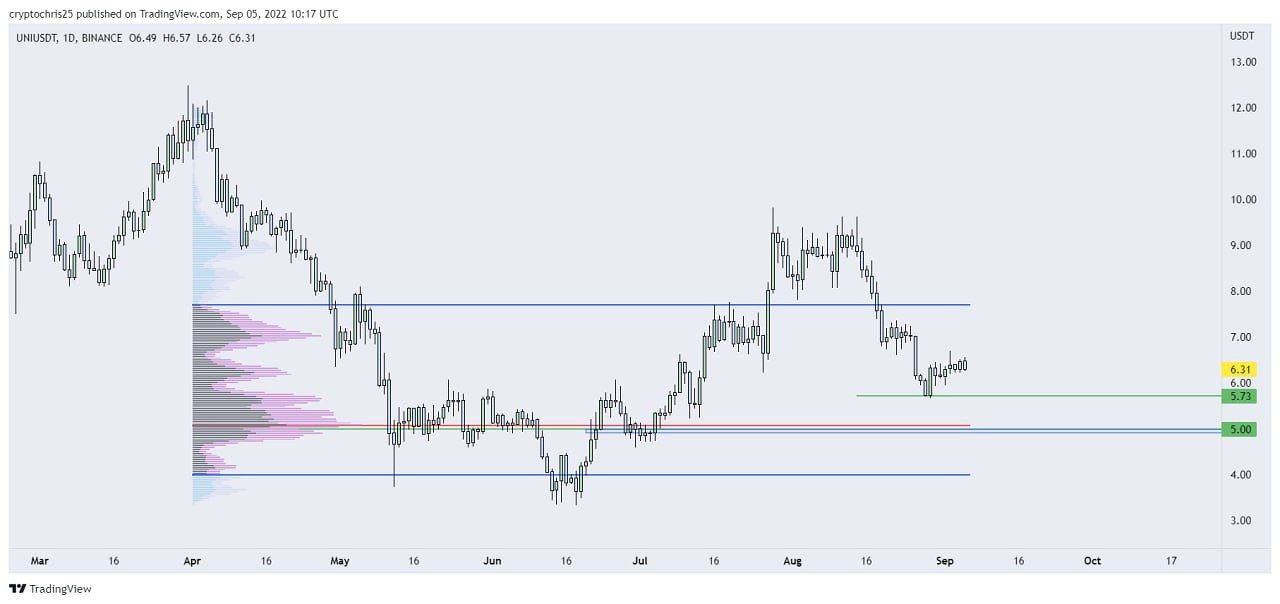
UNI/USDT TRADE CHART
UNI/USDT
After bottoming out in July this year, we saw a price shift market structure with higher highs - higher lows
If we compare the current market structure, we can see a shift with lower highs and lower lows forming.
We have some daily support at $5.73, but if lost, then I will have my eye on $5.00 for a potential zone for a bounce
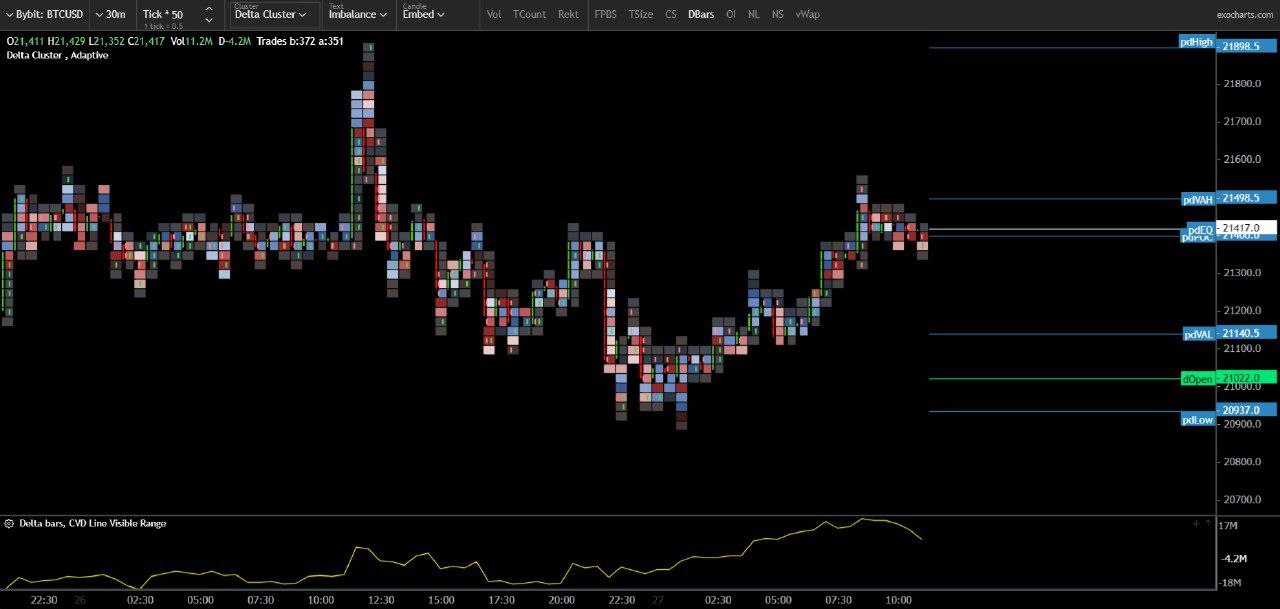
BTC/USD - Orderflow Chart!
Bearish CVD divergence on the smaller time-frames
What does this mean!
CVD stands for
The Cumulative Volume Delta
It displays the cumulative volume changes based on the volume traded by market sellers versus buy the buyers and is displayed similar to a moving average.
In the below chart, we can see that despite the CVD line moving higher and higher, the BTC price has made a lower high, indicating a trader is absorbing all the market buys with sell limit orders.
Of course, you should NOT base your trade around this one thing but instead, use it as a confluence as part of your trading plan
For example, If price hits a Fibonacci level of resistance and we see bearish CVD divergence forming, this adds further conflict to look for a short setup
Source of potential text plagiarism
Plagiarism is the copying & pasting of others' work without giving credit to the original author or artist. Plagiarized posts are considered fraud.
Guide: Why and How People Abuse and Plagiarise
Fraud is discouraged by the community and may result in the account being Blacklisted.
If you believe this comment is in error, please contact us in #appeals in Discord.