Chart update: Bitcoin Bart pattern | FED | Liquidity
Bitcoin whales sure have a way to find liquidity. Today's analysis showcases the exact reason why I love charts, but avoid Bitcoin trading. The market makers are stronger than teeny sardines; they need humongous liquidity pools and know where to find.
It's been eleven days since my last analysis. On that occasion, Bitcoin had broken out of an ascending triangle on its way above the 200 day EMA. I also showed the Ichimoku cloud to back the price action / pattern analysis. I finished that post with a warning: "Bitcoin likes to slow down after a breakout to form what is called a Bart pattern (when it retraces back in a single red candle) [...]"
Posted on LeoFinance, 3/27/2022: Quick chart update: Bitcoin breakout ongoing
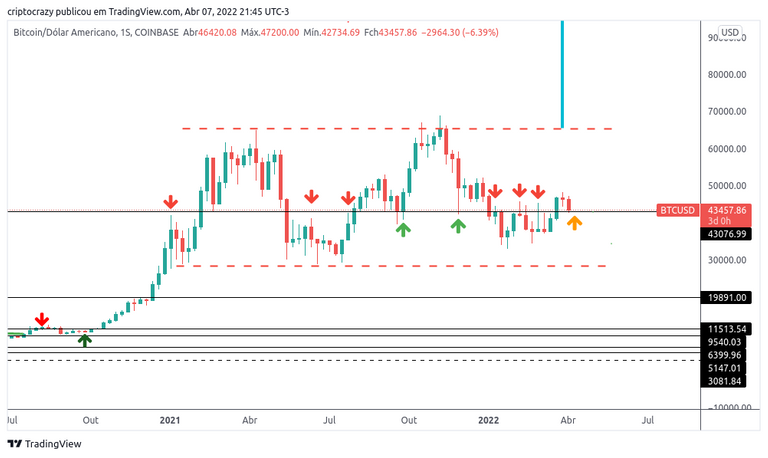
Weekly analysis
One big question: Will Bitcoin consolidate the previous resistance as support (orange arrow)?
Text-book price action there. Bitcoin is trading inside a parallel channel and is testing the 43,000 dollar support line. If it consolidates this support, I see it going to 50,000. However, two factors may influence the price; one fundamental, the other technical.
1.) The FED is finally worried about inflation and is talking about removing liquidity from the system. If that happens, dollars become scarce, credit more expensive, and a recession is expected. It's concerning. How much of the Bitcoin market cap is credit? This fundamental factor may bring Bitcoin down.
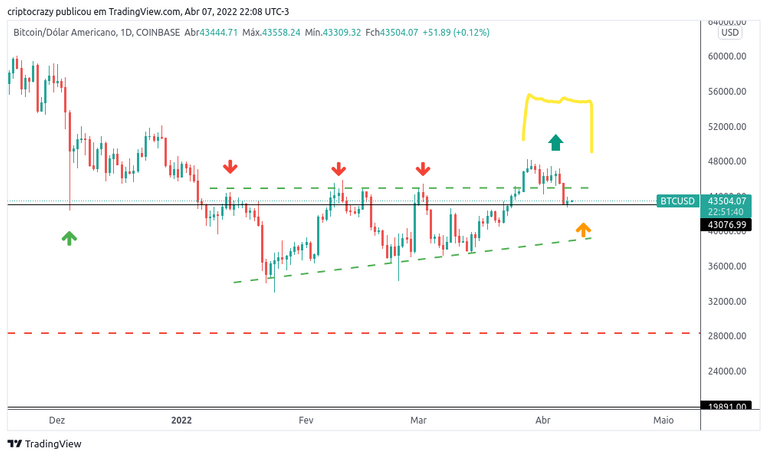
2.) The zone below 43,000 may be packed with stop-losses. Market makers know that. If Bitcoin dips into that pocket, we might see a cascade effect down. Let's talk about liquidity on the daily chart.

Daily analysis
When I talked about the Bart pattern, this is what I meant. Although created as a joke among cryptocurrency traders, the Bart pattern is slowly becoming part of history. Technically, the Bart pattern is a bull trap.
A bull trap is a false signal, referring to a declining trend in a stock, index, or other security that reverses after a convincing rally and breaks a prior support level. The move "traps" traders or investors that acted on the buy signal and generates losses on resulting long positions. — Investopedia

Can you see the Bart Simpson? After that low-volume breakout Bitcoin slowed down and completely retraced inside the triangle, trapping bulls. Classic Bitcoin move.
What to expect?
For the first time I don't have a bias. As a hodler, I'll keep on hodling. If I were a trader, staying out would be my choice; at least until this week's close.
Let's see what the market shows us.
Keep caml and hodl
Posted Using LeoFinance Beta
Congratulations @mrprofessordaily! You have completed the following achievement on the Hive blockchain and have been rewarded with new badge(s):
Your next target is to reach 400 upvotes.
You can view your badges on your board and compare yourself to others in the Ranking
If you no longer want to receive notifications, reply to this comment with the word
STOPTo support your work, I also upvoted your post!
Check out the last post from @hivebuzz:
Support the HiveBuzz project. Vote for our proposal!
https://twitter.com/mrprofessor_/status/1512239145481121792
The rewards earned on this comment will go directly to the person sharing the post on Twitter as long as they are registered with @poshtoken. Sign up at https://hiveposh.com.