Death Cross Dummified

Death cross.
I have seen this term once, twice, thrice, no. A lot of times especially during these times when the BCH market is down and a tad bearish. So obviously, my ever-curious and speculating mind asked a lot of questions. Questions that alone, I could not even begin to interpret. What on fresh hell is this? What does it mean to my precious BCH? Shall I sell? Shall I buy more? What do I do?
Of course, I do not have a single clue so just like everyone else, I turned to my buddy to look for help and maybe some of the answers, my buddy's internet has answers to everything, although some of its answers are not entirely true, at least he's got some idea.
What's a Death Cross?
So what the hell is a death cross? As I gathered from the internet a death cross is an X mark or pattern that appears on a technical chart of an asset. The cross is made when the asset's short-term moving average crosses below its long-term moving average.
Hold up! Wait a minute that makes a lot of sense, but only if you know what on Earth moving averages are. Okay maybe let's take a look at what moving averages mean first.
Moving Average
Moving average is a calculation tool in statistics wherein you calculate the averages of a series of subsets from a full set of data. The tool is also used in technical analysis in finance as an indicator of an asset's trend. This moving average is represented by a line in a technical analysis chart. There are several types of moving average or MA, but to understand it better we'll just take a look at the simplest type of MA which is called Simple Moving Average. That's so easy, right? It's in its name already, simple.
The formula for calculating the simple moving average or SMA is depicted below :

Where A means the average price in a certain period and n is the number of periods. In the context of Death Cross, the period of time that are often used are 50-day and 200-day moving averages. That means that the short-term is the 50-day and the long-term moving average is 200-day.
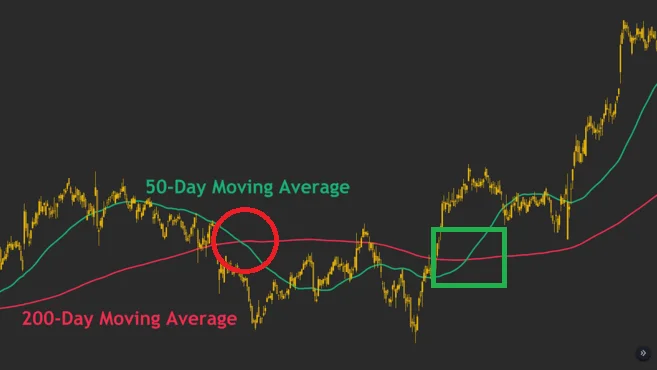
A death cross will appear when the trendline of the 50-day moving average crosses below the trendline of the 200-day moving average. Just like displayed in the following image:

The death cross is circled in red. As you can see, the green line which was the 50-day MA crossed below the 200-day MA (somewhat violet-red).
What Does it Mean?
Alright, we can see the so-called Death cross, now what? What does it mean? As you can see in the image above, a death cross may mean a further downtrend of the asset's price. A lot of experienced traders look at the Death cross as a strong indicator and signal of a pending and prolonged bearish market. As per observed from previous confirmed and noteworthy occurrences of death crosses, the losses incurred in the bearish trend following the death cross may prove to be severe. Some may even lose up to 90% of their investments.
Basically, a death cross may easily mean a signal to sell if you are looking for a quick profit and would not like to suffer a significant amount in losses. But since there is no definite indicator of any market's behavior, a death cross may also potentially be a false signal. It means that even though a death cross appeared, the market may even be bullish after that. Occurrences of such scenarios have also been observed in the past, you may look up Facebook's stock chart in 2018 for reference.
Golden Cross
Golden Cross is the opposite of Death cross in visuals and in essence. If the death cross means negativity in the market's trend, the golden cross spells out everything that is positive. This pattern occurs when a stock's short-term MA crosses above its long-term MA. Traders see this as a definitive signal for a stock's price uptrend. You may take a look at the image above, the golden cross is boxed in green.
Epilogue
Although indicators, patterns, signs, and symbols in the universe may provide us an organized view of the data, the conclusion that may be drawn from them may very well be subjective. Our decision-making skills are from time to time affected by our personal biases. Some signals that may indicate a sure buy or sell tell for some may be insignificant for other traders, and vice versa. I guess that there is really no surefire way to tell what would happen to an asset aside from inside trading, which is as we all know, illegal. So, using all the information available it is always up to us to go with our guts, to go with the flow, or just play it according to our mood.

Hey there!!!
Thank you for joining me once again in learning a lesson in TA.. It's been a slow-paced kind of learning don't you think? But well, I really am not pushing to be a trader just yet because I don't think I have the heart. I am too emotional for playing with the market and my time is so limited to be a day-time trader, not to mention my focus is all over the place. I just enjoy learning and studying new things. I may not be an expert in that field, but at least I know some things, and I am learning new stuff here and there, albeit slowly.
Cheers!!!
Posted Using LeoFinance Beta
Congratulations @meitanteikudo! You have completed the following achievement on the Hive blockchain and have been rewarded with new badge(s):
Your next target is to reach 500 comments.
You can view your badges on your board and compare yourself to others in the Ranking
If you no longer want to receive notifications, reply to this comment with the word
STOPTo support your work, I also upvoted your post!