Segmentation of medical images with a limited number of annotations
Introduction
Recently, a group I was part of managed to publish the first scientific paper on using artificial intelligence to segment medical images with a limited number of annotations. This was quite a difficult thing to do as it was our first time using nn-Unet however by staying with it we got surprisingly good results.
Abstract
This work proposes a new approach for blood vessel segmentation using real medical data for abdominal aortic aneurysm (AAA) segmentation provided by Gdansk Medical University. We successfully developed an algorithm to minimize the number of annotations needed using the KMeans clustering algorithm. Our solution achieves 99.94% accuracy and 92.86% Dice measure for AAA segmentation, which is better than other state-of-the-art publications.
State of the Art Analysis
The aorta which is the largest artery in the human body is divided into specific segments, the ascending part of the aorta and the replacement part of the aorta. When the diameter of the aorta is dilated by more than 50% or the equivalent of 3 cm, aneurysms occur. Aneurysms can occur in any of the aortic segments, but most commonly occur in the abdominal segment.
Over the last few years, ever-evolving technology has made it possible to use deep learning techniques in the field of medical image analysis allowing to perform classification, segmentation, and detection of organ features. Below are examples of aortic segmentation techniques.
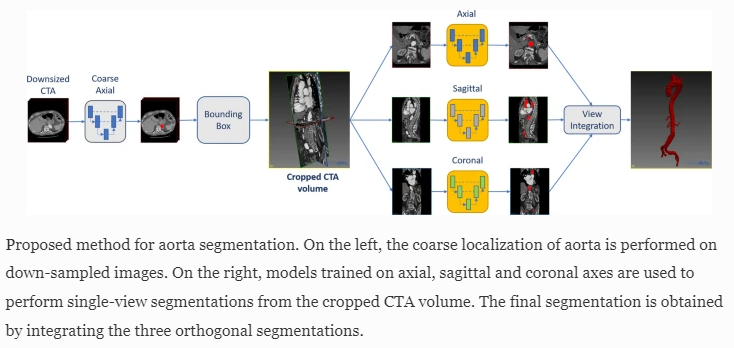
Alicia Fantazzini in her work proposed the creation of an automatic 3D segmentation of aortic CT scans. In order to overcome the limitations of manual and semi-automated segmentation tools, the researchers decided to develop a deep learning-based system that segments CTA scans from the ascending aorta to the iliac arteries with 3D spatial coherence. The proposed solution is to use a 2D U-Net trained on down-sampled axial slices used to localize the ascending aortic mask from CTA scans. In the next stage, the identified ROI region of interest is processed by 2D U-Nets trained on the axial, sagittal and coronary planes, which are obtained by extracting 2D cross-sections along the x, y, and z axes of the CTA scan at a higher resolution. In the final step, the predictions provided by the three U-Net planes are combined to complete the segmentation.
3D Automatic Segmentation of Aorta
Julia M. H. Noothout in her work developed automatic segmentation of thoracic aortic segments in low-dose chest CT. As in Alicia Fantazzini's thesis regarding the time-consuming nature of manual annotation of CT scans without contrast enhancement and at low radiation dose, she proposed a solution using automatic segmentation of the ascending aorta, aortic arch, and thoracic aorta replacement. The researchers performed the segmentation using a diluted CNN neural network classifying voxels in axial, coronal and sagittal image sections. The authors were able to obtain a Dice coefficient of 0.83 using 24 low-dose chest CT scans.
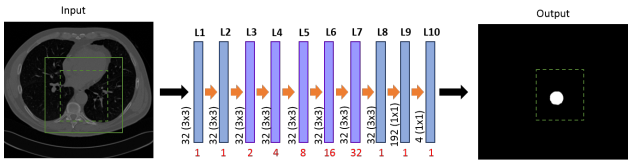
Architecture of the dilated CNN
Another work is DeepSeg, a system for abdominal organ segmentation using deep convolutional neural networks. The convolutional network consists of a pair of full 3D convolutional layers and takes two input features to ensure local and global consistency. With a set consisting of 70 CT images, an average Dice value of 0.757 was obtained for 13 organs, while for the aorta alone the value was 0.860.
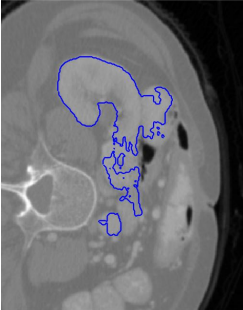
Example of the resulting segmentation of the right kidney for
a CT slice from the test set
Medical University of Gdansk (GUMED) dataset
To conduct further experiments with the nnUNet network architecture, we were provided with data from the Medical University of Gdansk (GUMED) covering arterial segmentation to detect abdominal aortic aneurysm (AAA).
The data we received was a set of files in the NIfTI extension (nii.gz) prepared by experts at GUMED:
- "xx.nii.gz" - full image
- "xx_segm.nii.gz" - manually tagged AAA
- "xx_label.nii.gz" - manually aggregated AAA and vascular tree labels as two separate classes
- "xx_contrast.nii.gz" - semi-automatically marked vascular tree, corrected and appropriately trimmed manually according to established standards
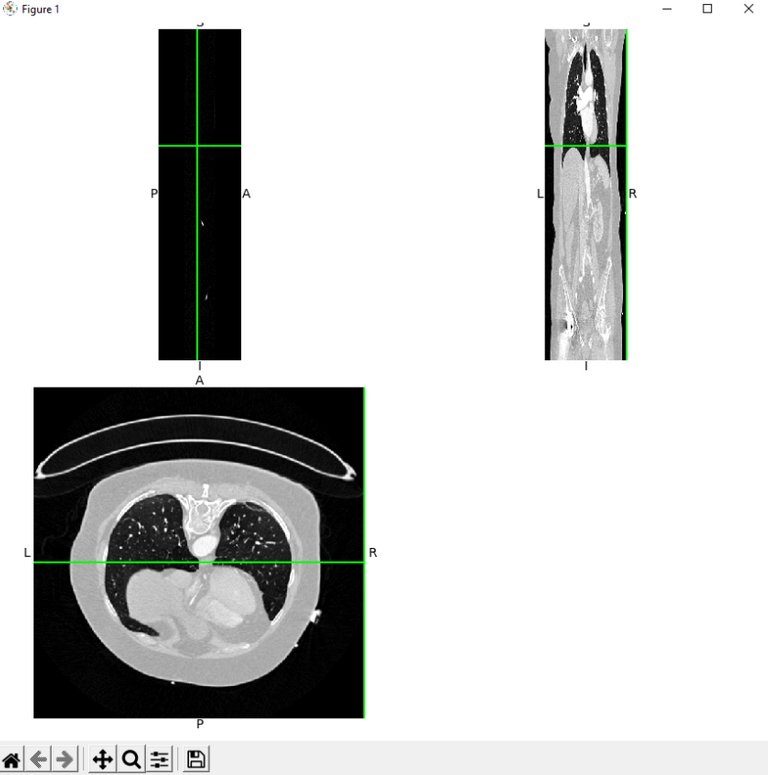
An example of the full set of files for one case including their dimensions and visualization:
As part of the data preprocessing, class numbers were sorted by adopting the following designations:
- 0 - background
- 1 - aneurysm
- 2 - vascular tree
In addition, for the cases that did not have ready "xx_label.nii.gz" files, in order to increase the amount of usable data, new "xx_label.nii.gz" files were created from "xx_segm.nii.gz" and "xx_contrast.nii.gz" files by creating a NumPy array from them and writing to a new NIfTI type file. Finally, three datasets were obtained, which were then used for three different tasks:
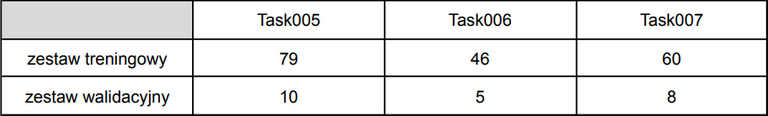
- Aneurysm segmentation using pre-made segmentation masks from "xx_segm.nii.gz" files (Task005)
- Segmentation of the aneurysm and vascular tree using pre-made annotations from the files "xx_label.nii.gz" (Task006)
- Segmentation of aneurysm and vascular tree using "xx_segm.nii.gz" and "xx_contrast.nii.gz" files and generating new "xx_label.nii.gz" + ready-made "xx_label.nii.gz" files based on them (Task007)
Training data
The numbers of training and validation sets for one of tasks are shown
in the table below:
All images and labels used were of size (512, 512, X), where X is a value in the range
(100-2500), and their counts are shown in the histograms below.
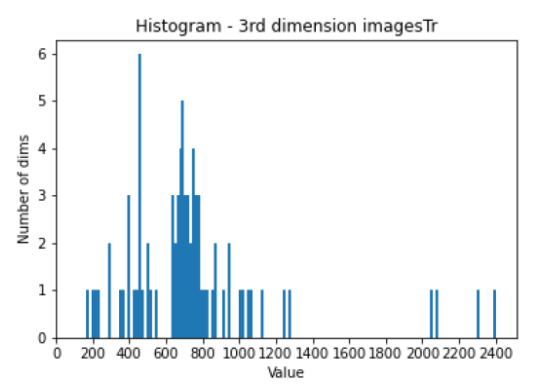
Plot of the abundance of Task007 training images as a function of their dimensions
The following results were obtained for nnU-Net training using Task007. The red and blue colors describe the loss for the training and validation set images, respectively. Green color indicates evaluation metric - average dice score.
Task007 - two-class segmentation of created annotation files containing manually corrected contrast and abdominal aortic aneurysm. In this set, each file was checked for integrity, size, pixel value, or offset. For this experiment, a change was also made to the NVIDIA DGX-1 (deep) compute server, due to problems with the GPU on the previously used NVIDIA DGX (ai). The problems included interruption of training due to recurring GPU crashes, as well as the long duration of the workout. On the ai server, training times per cycle could range from 25 minutes to as long as 1.5 hours. On the deep server, we were using Nvidia RTX 2080Ti card, for which the time per cycle was about 7-8 minutes.
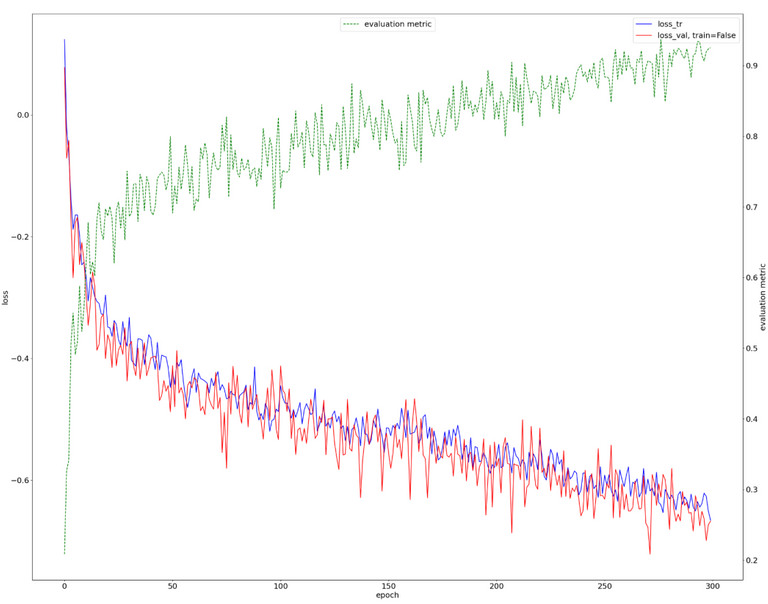
The 300 epoch-long training was successful, with an indication that it could be extended. The estimated Dice metric is approximately 90%.
Prediction results on the validation set given separately for each class:
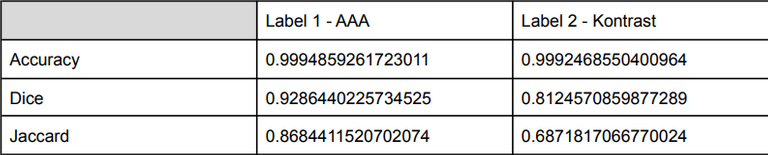
The obtained results seem to be correct, the developed model handles aneurysm segmentation very well. For the vascular tree, the achieved evaluation measures are much lower, especially the Jaccard value which is about 69%.
Visualization
For the segmentation visualization, SimpleITK, scipy, matplotlibbokeh, and mpl_toolkits libraries were used. Three paths to the image, mask, and prediction are initially fed to the algorithm. In the next step, all the images are divided into sections, which it is possible to generate a 3d view
slices = []
    if len(first_patient_data.shape) == 3:
        for slice_Number in range(first_patient_data.shape[2]):
        img = first_patient_data[:, :, slice_Number]
        slices.append(img)
Once the splitting is done, the scan sampling step follows. To view the CT scan in 3D isometric form, and to compare different scans, make sure that each slice is sampled in 1x1x1 mm pixels and slices.
def resample(image, scan, new_spacing=[1, 1, 1]):
    spacing = np.array(scan.GetSpacing())

    resize_factor = spacing / new_spacing
    new_real_shape = image.shape * resize_factor
    new_shape = np.round(new_real_shape)
    real_resize_factor = new_shape / image.shape
    new_spacing = spacing / real_resize_factor
    image = scipy.ndimage.interpolation.zoom(image, real_resize_factor, mode='nearest')

    return image, new_spacing
After sampling, each image has a shape (360,536,320). The images thus transformed can then be visualized and saved to an html file. At the very beginning, the function takes the image, mask, and prediction values and performs a transpose to determine the verticality of the image.
p = image.transpose(0,2,1)
p2 = label.transpose(0,2,1)
p3 = output.transpose(0,2,1)
The function measure.marching_cubes is then used with which 2D surface meshes are extracted from the 3D volume. The algorithm works by iterating across the volume, looking for regions that exceed the level of interest. If such regions are found, triangulations are generated and added to the output mesh. The final output is a set of vertices and a set of triangular faces. It is required to determine the data volume and iso-surface values in the case Hounsfield units representing the aorta are used abdominal aorta.
verts, faces, norm, val = measure.marching_cubes(p, threshold_1, step_size=1,allow_degenerate=True)
vertsM, facesM, normM, valM = measure.marching_cubes(p2, threshold_2, step_size=1,allow_degenerate=True)
vertsO, facesO, normO, valO = measure.marching_cubes(p3, threshold_2, step_size=1,allow_degenerate=True)
The next step is to create a visualization of the image by using the Poly3DCollection function that generates a collection of triangles forming the image. The alpha value indicates the transparency of the image.
mesh = Poly3DCollection(verts[faces], alpha=0.20)
mesh2 = Poly3DCollection(vertsM[facesM], alpha=1)
mesh3 = Poly3DCollection(vertsO[facesO], alpha=0.5)
The final step is to add all the elements to the graph, change the colors and save the image.
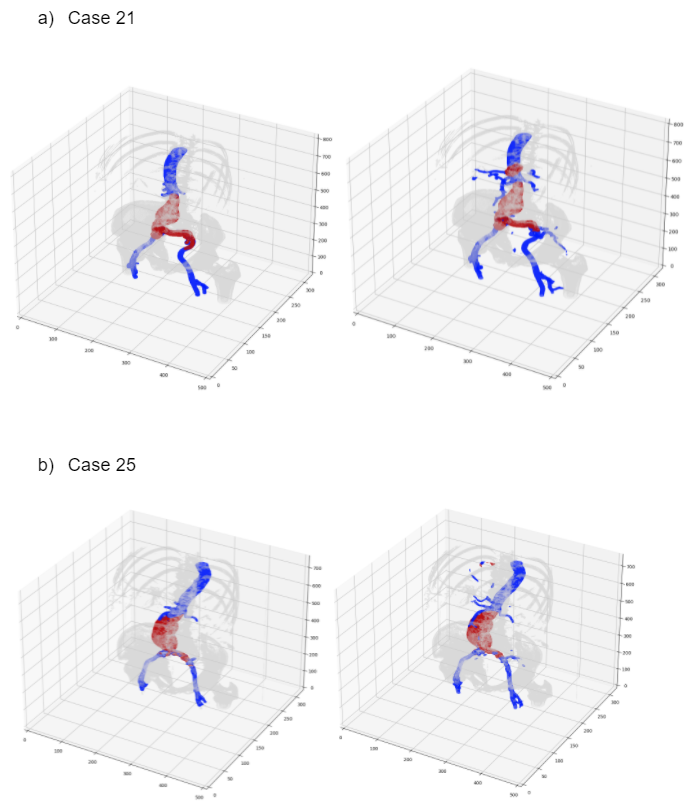
Visualization effects (left column shows Ground truth and the right column shows Output)
Summary
Thank you to everyone who took the time to at least stop and read this post. This is a very important moment for me because I never would have expected to be able to participate in such a great thing that makes sense and can help doctors in the future, in the preliminary examination of whether the person examined may have an aneurysm. I think this is just the beginning of a very interesting scientific adventure. I am already working on another research paper at this point, which I hope to write more about soon.
If You want, go check my recent posts
Complete overhaul of Cartel bot
News from the world of games on Hive! #2
What's New at Cartel Bot
New Cartel BOT for OneUp community!
News from the world of games on Hive! #1
If You want, go check my reviews
A collection of play2earn projects for 2022
What games are we looking forward to in 2022? - Part 1
Car racing game like football manager? - RaceFi game review
Blokchain Brawlers
Araker Legen of Ohm
Chumbi Valley
Sipher
Star Atlas, or how to steal a gamer's heart
I also invite everyone who has not yet joined our 1UP Community to see what we are up to!

For the best experience view this post on Liketu
Great post, as much as I had to read it twice to understand even a little bit of what's happening 😂
!1UP
Hahahaha, thanks!
You have received a 1UP from @mezume!
@stem-curator, @vyb-curator, @pob-curator, @neoxag-curator, @pal-curatorAnd they will bring !PIZZA 🍕
Learn more about our delegation service to earn daily rewards. Join the family on Discord.
PIZZA Holders sent $PIZZA tips in this post's comments:
@curation-cartel(20/20) tipped @kwskicky (x1)
Learn more at https://hive.pizza.