ON CHAIN OVERVIEW: OPPORTUNITIES TO BUY BTC AND ETH AT A DISCOUNT?
INTRODUCTION
The turbulence that we are experiencing in these days on the markets need to be deepened, also in the light of possible entry opportunities. Right now, the most interesting currencies, which in a sense are the measure of investors' attention to cryptocurrencies, are bitcoin (as always) and Ethereum.
The latter, as I also argued in a previous post of mine, has undergone an evolution in the last year, with the change in fees to miners and the introduction of ETH 2.0. But what makes ETH a currency with disruptive potential is not so much its use as an exchange currency, but its ecosystem and the innovation it is bringing to the entire sector. Here, in my opinion, in the next few years BTC will surely appreciate again, reaching $200 K or maybe more, but ETH (like DOT, ADA and TERRA, other currencies with booming ecosystems), in ratio, will do even better.
I'd like to point out that this post is a compilation of the work submitted by other people, all of whom are mentioned gradually throughout the post, but to whom I'd like to highlight in this introduction: these are the teams at Santiment, Cryptoquant, Intotheblock and Lookintobitcoin.
So let's start the roundup of metrics we've collected over the past few days.
BITCOIN
Advanced NVT Signal is an evolution of the NVT Signal
NVT Signal takes the total value of the Bitcoin network (which is another way of saying its market cap) and divides it by the 90 day moving average of daily transaction value.
NVT Signal = Network Value / 90DMA of Daily Transaction Value
NVT Signal was originally used as a way of picking cycle tops, but due to more coins being held off chain over time, the efficacy of NVT Signal has declined.
source: https://www.lookintobitcoin.com/charts/advanced-nvt-signal/
This adaptation of NVT Signal adds standard deviation bands to identify when Bitcoin is overbought (red zone) or oversold (green zone). This can provide intra-cycle take profit points for Bitcoin investors.
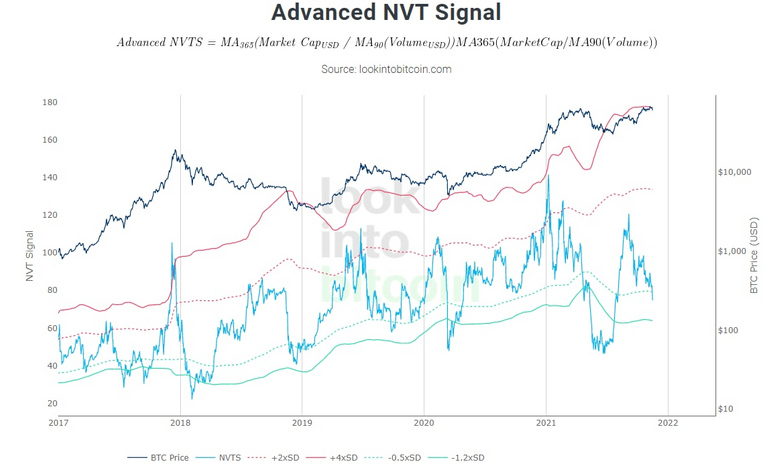
According to this index, which compares onchain transaction volume with market capitalization. bitcoin is oversold.
oversold at 60k, means we have a lot of room left to get into the red zone (overbought).
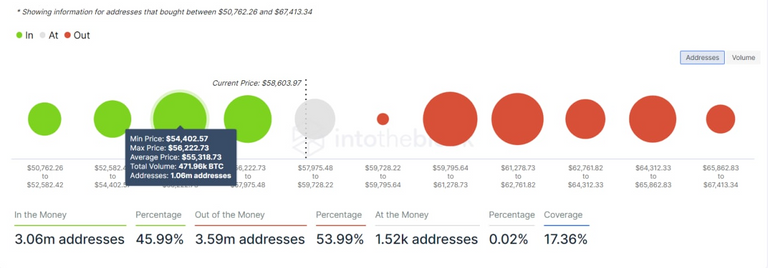
The most robust support we can consider is at 54.4k/56.2k, with 471.96k bitcoins in 1.06 M addresses. (avg. price 55.3k), so let's not be surprised if we could go to these levels in the coming days.
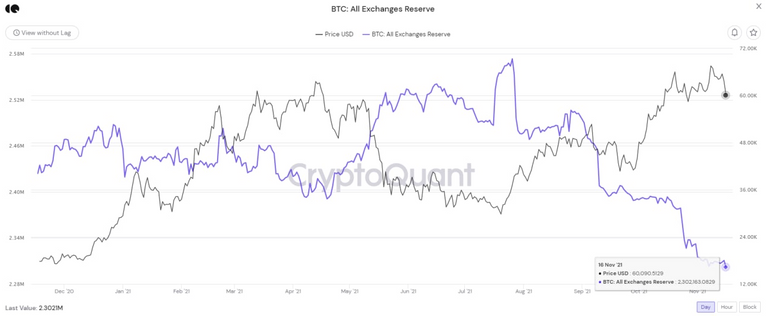
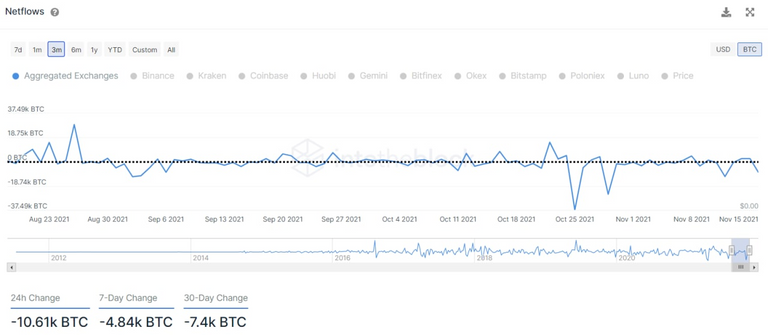
We can say that net reserves of exchanges yesterday dropped and netflows were negative (more bitcoins went out than came in). The overall picture remains bullish, we still have a large room for maneuver upwards, as we have seen with the advanced NVT signal index.
ETHEREUM
Regarding ETH the trend of coin reduction on exchanges is in full swing.
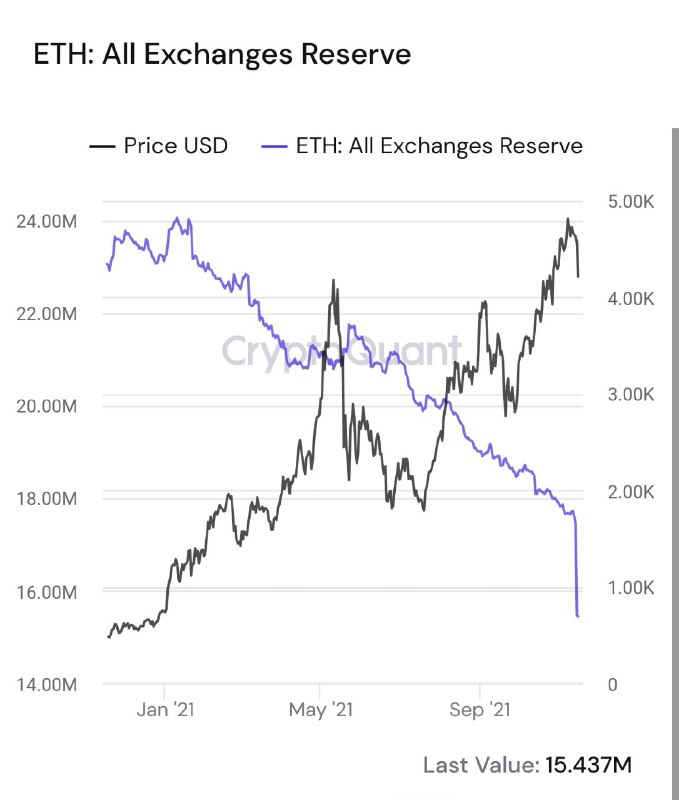
From a fundamental perspective, the outlook is much more than positive.
Not only does Ethereum find itself to be a deflationary cryptocurrency but the supply on the market continues to shrink.
Holders are choosing to move to their own private wallets looking forward to medium to long term rises.
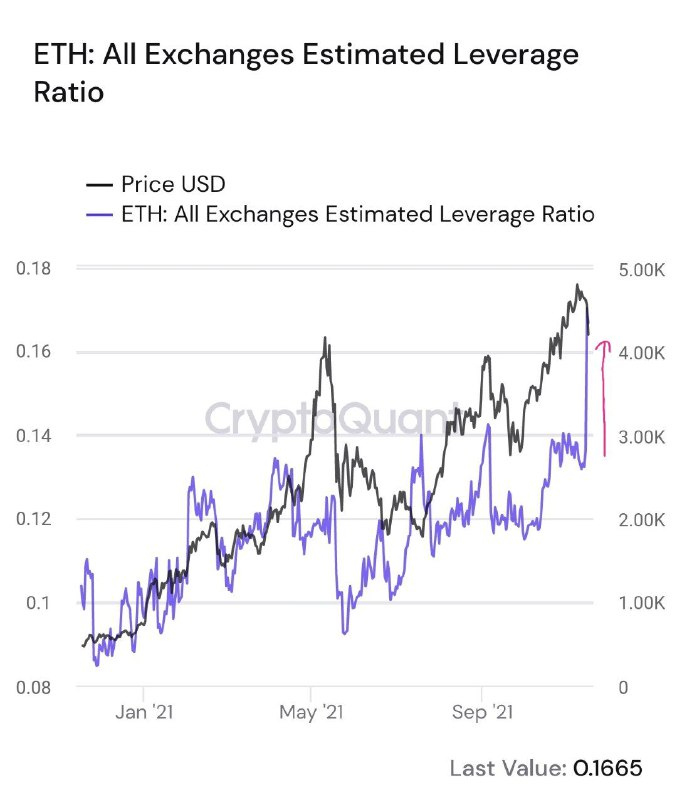
There could not have been a more positive signal in the last few days, as after the declines seen in the last few days (about -15% from the highs), many of the ETH holders have still chosen to take their Ether outside the exchanges.
Moreover, leverage on Ethereum has increased exponentially during the last declines, denoting a very strong optimism and interest to buy at lower ETH prices.
ENTRY OPPORTUNITY
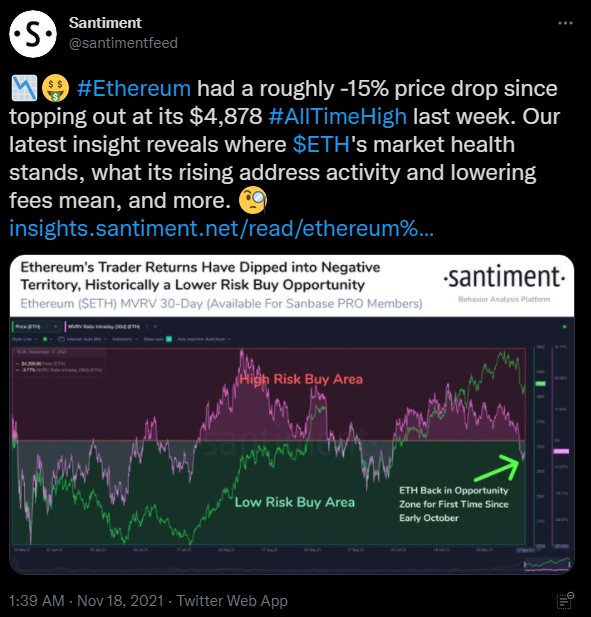
While some traders suffer losses as a results of cryptocurrency market declines, market participants who haven't yet entered positions are now able to enter while assets remain within the opportunity zone, in line with market data provided by Santiment.
What is a "low-risk buying zone"?
it's always worth recapping that the cryptocurrency market is an immature and extremely risky market thanks to its volatility and lack of regulation that permits for easier price manipulation. However, we will say that there are some entry zones that allow you to mitigate the danger and so have a high return/risk ratio.
The risk of the buy or sell area is set by the MVRV ratio, which is calculated by dividing the entire market price of an asset by its realized value. The indicator shows whether an asset is "overbought" or trading at a reduction.
Source and further reading: https://insights.santiment.net/read/ethereum%3A-where-we-are-after-the-dump-6796
According to the information provided by the MRV indicator Ethereum has entered the "discount zone" for the primary time in almost two months, so it's going to be less risky to enter the market now. But the MVRV ratio will be used with various settings, and during this case, the indicator is about to point out the short-term market condition.
The long-term version of the identical indicator shows that the value of Ethereum continues to be overexposed, and so as to enter the "Low Risk" zone, it must be adjusted by another 40%, which suggests it should be trading at around $2,500.
That's all, thankS for reading.
Posted Using LeoFinance Beta
Congratulations @cryptomaster5! You have completed the following achievement on the Hive blockchain and have been rewarded with new badge(s):
Your next target is to reach 500 upvotes.
You can view your badges on your board and compare yourself to others in the Ranking
If you no longer want to receive notifications, reply to this comment with the word
STOPTo support your work, I also upvoted your post!
This post has been manually curated by @bhattg from Indiaunited community. Join us on our Discord Server.
Do you know that you can earn a passive income by delegating your Leo power to @india-leo account? We share 100 % of the curation rewards with the delegators.
Please contribute to the community by upvoting this comment and posts made by @indiaunited.