7 Cryptos Making Technical Analysis Moves for 3/15/2022
For this 3/15/2022, we look at cryptocurrencies making waves from Technical Analysis Perspective.
Traders of different trading timeframe philosophies would agree that it is important to gain an understanding of a currency pair's price action. This importance varies among traders, but it still remains important as traders look to buy low and sell high. Every day presents new opportunities to examine cryptocurrencies and their price movement (technical analysis).
Let’s examine the cryptocurrencies that have made the most recent technical analysis moves with various indicators. This is not an exhaustive list, this is just a selection of cryptos that have made a significant movement or have made a shift. None of the below is financial advice, you are encouraged to do your research before trading or investing in any securities. Cryptocurrency positions carry risk of loss of investment principal.
Cryptocurrency #1:BMIUSD
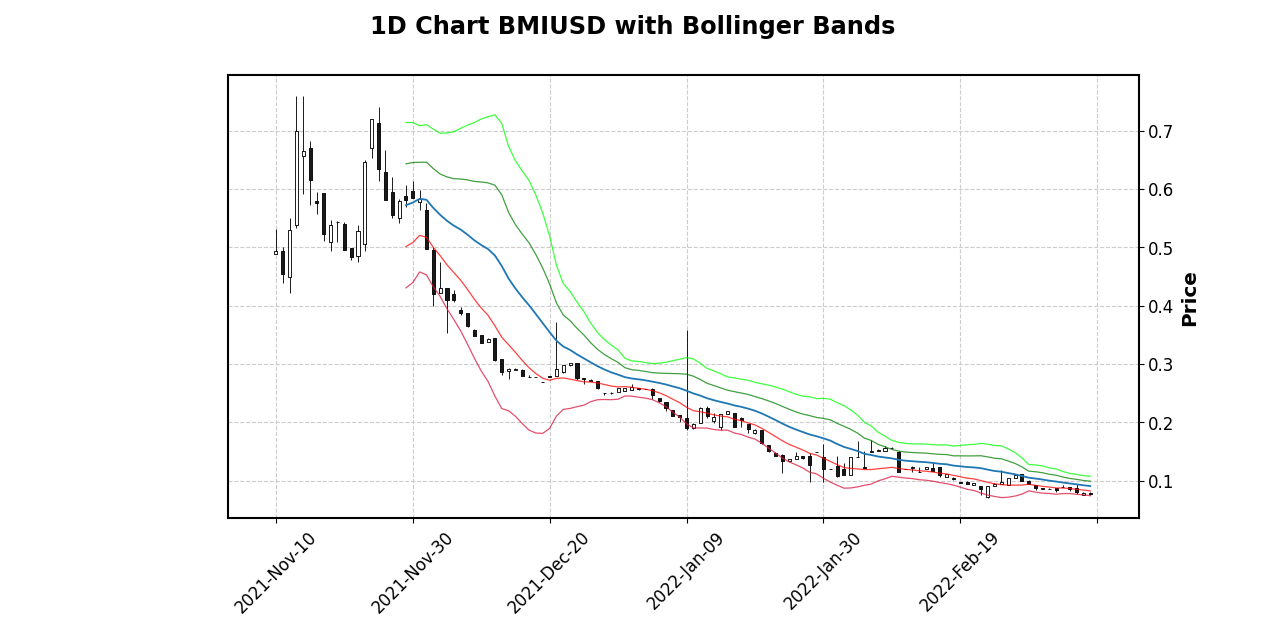
Right now, the daily trend is an downswing and the Bollinger Bands help confirm it as the price is nicely contained within 1-2 Standard Deviation levels below the mean.
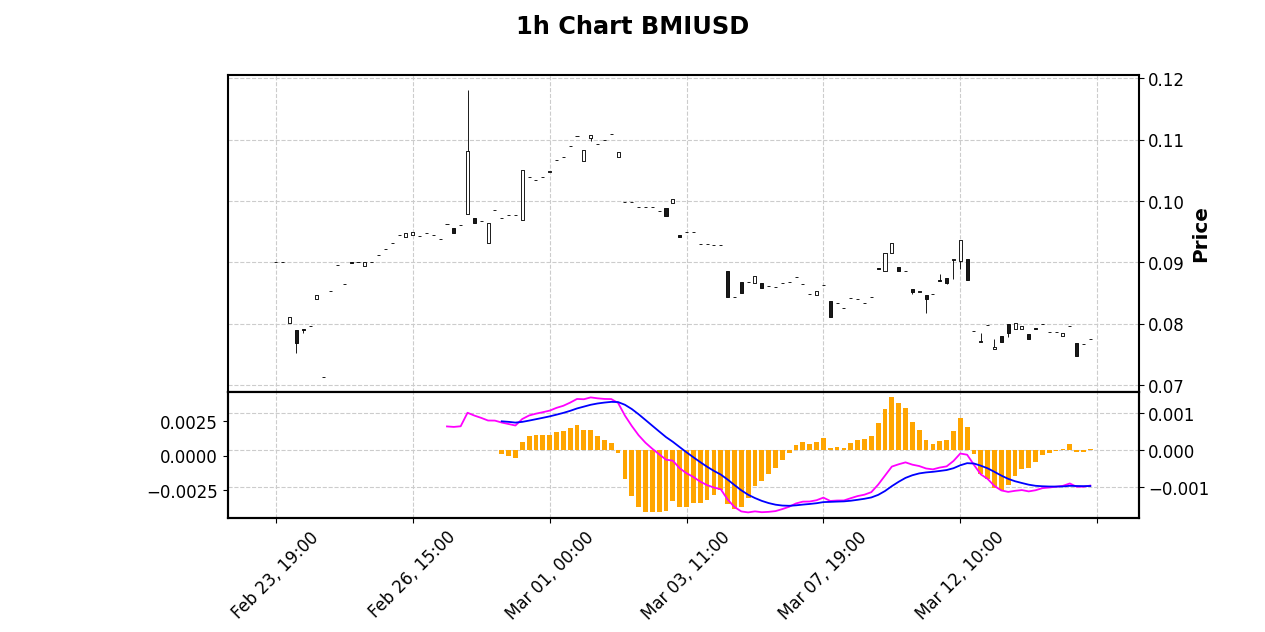
On the hourly chart for BMIUSD, the Moving Average Convergence Divergence (MACD) is showing a bullish signal, the signal line crossed above the MACD Line and the MACD Histogram crossed above the Zero Line in the previous trading hour on the hourly chart.
Cryptocurrency #2:BTGUSD
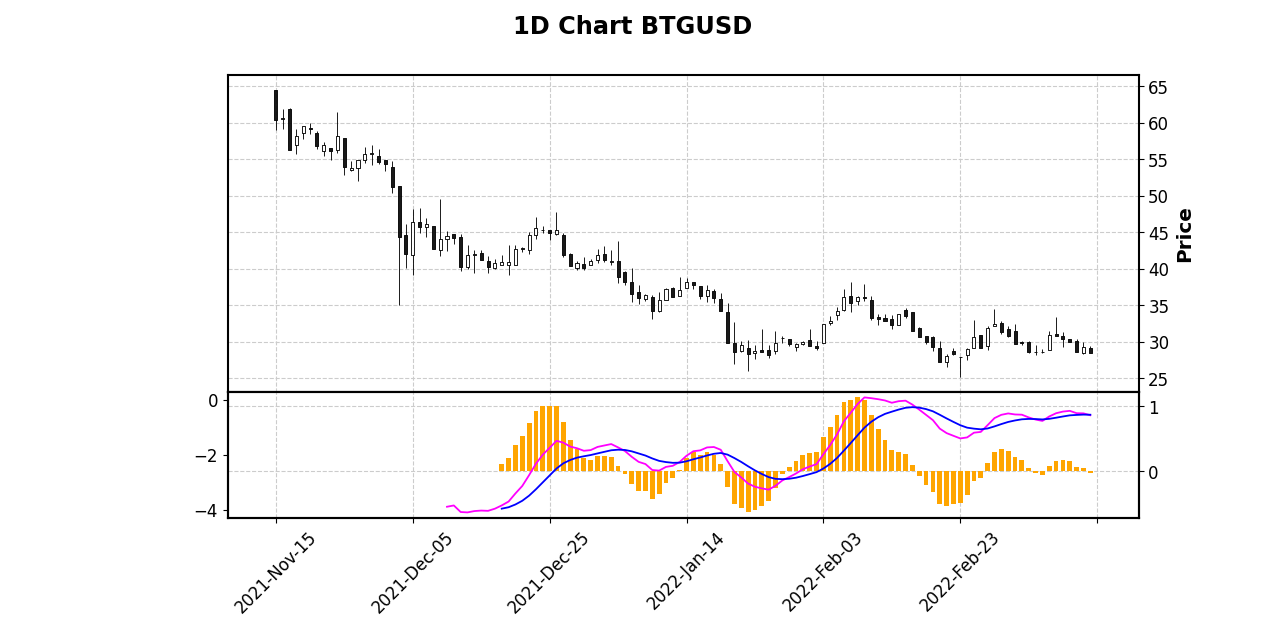
Examining the Moving Average Convergence Divergence (MACD) for BTGUSD, the signal line crossed below the MACD Line and the MACD Histogram crossed below the Zero Line in the previous trading day on the daily chart. This is a bearish signal, especially when combined with an downward price trend.

Examining the Moving Average Convergence Divergence (MACD) for BTGUSD, the signal line crossed below the MACD Line and the MACD Histogram crossed below the Zero Line in the previous trading hour on the hourly chart. This is a bearish signal, especially when combined with an downward price trend.
Cryptocurrency #3:FTMUSD
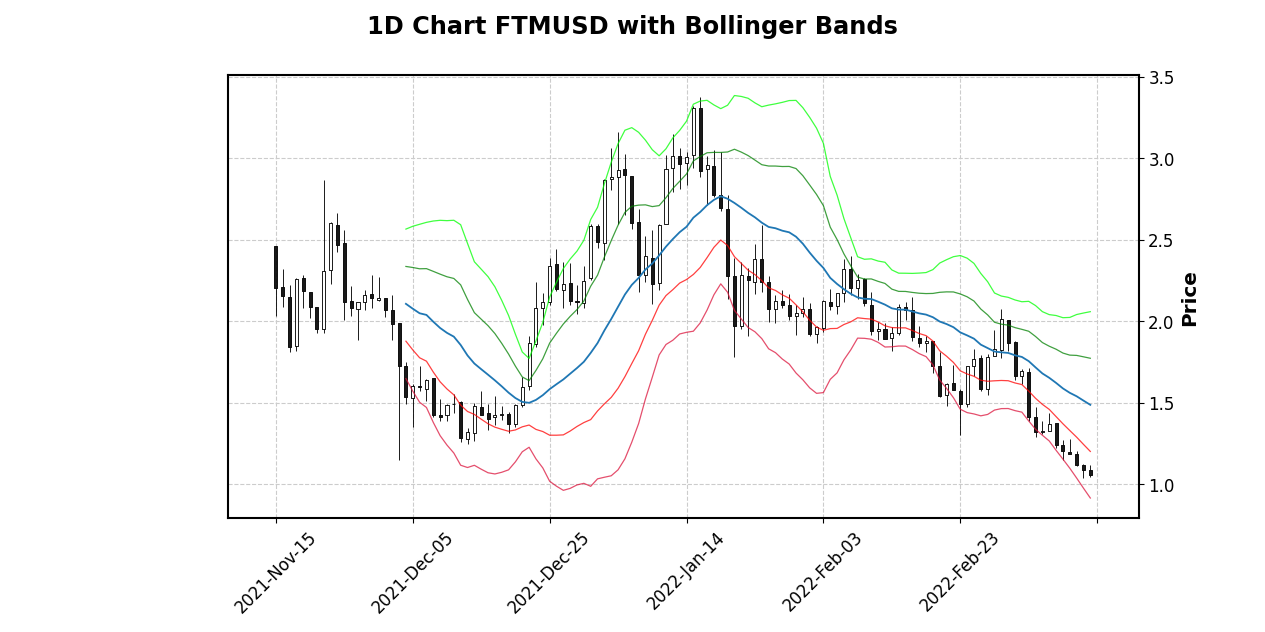
FTMUSD's daily trend is bearish and the Bollinger Bands support this as the price is contained between the first and second Standard Deviation levels below the mean.
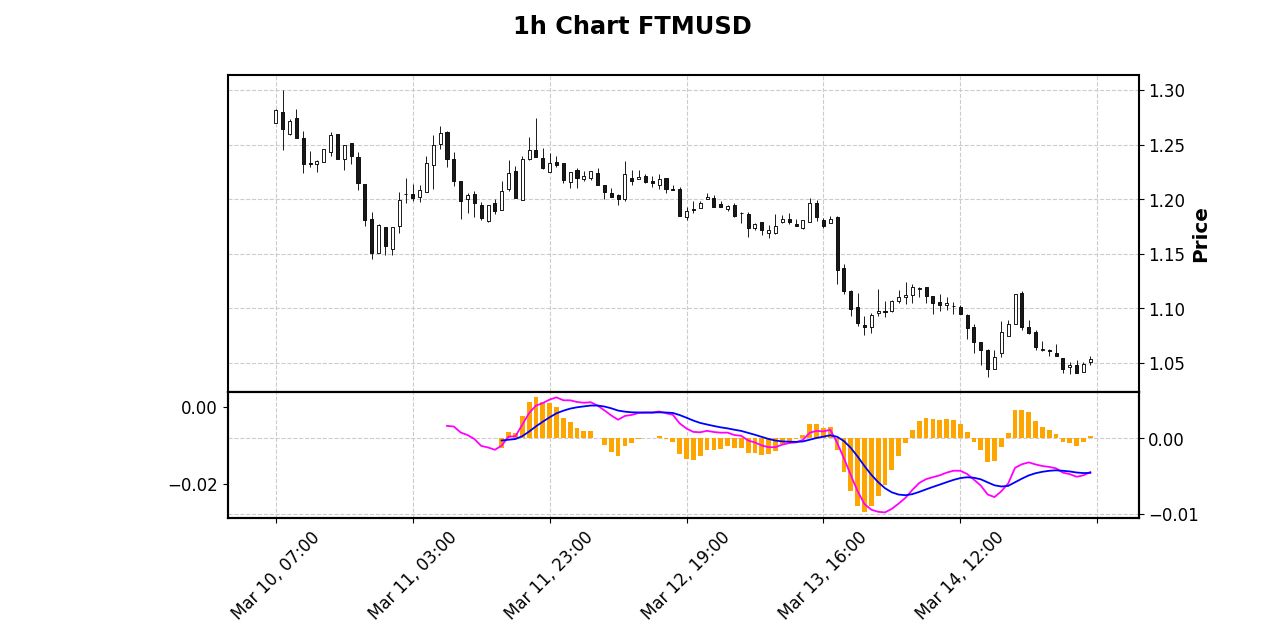
Examining the Moving Average Convergence Divergence (MACD) for FTMUSD, the signal line crossed above the MACD Line and the MACD Histogram crossed above the Zero Line in the previous trading hour on the hourly chart. This is a bullish signal, especially when combined with an upward price trend.
Cryptocurrency #4:USTUSD
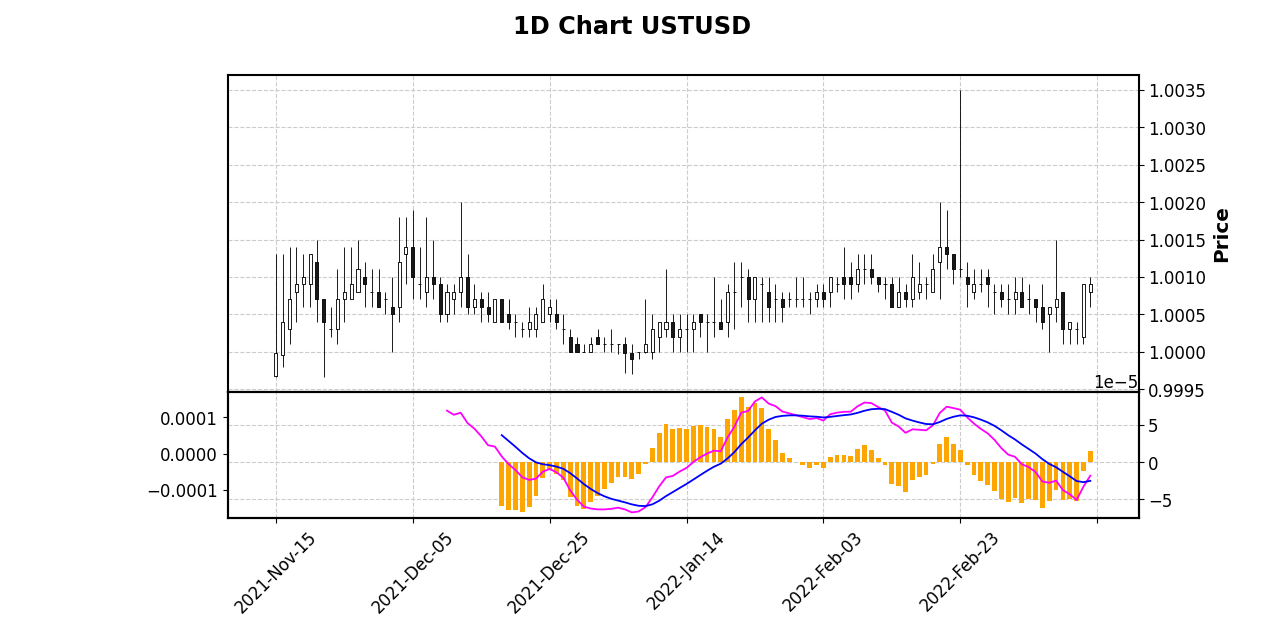
Examining the Moving Average Convergence Divergence (MACD) for USTUSD, the signal line crossed above the MACD Line and the MACD Histogram crossed above the Zero Line in the previous trading day on the daily chart. This is a bullish signal, especially when combined with an upward price trend.

On the hourly chart for USTUSD, the Moving Average Convergence Divergence (MACD) is showing a bullish signal, the signal line crossed above the MACD Line and the MACD Histogram crossed above the Zero Line in the previous trading hour on the hourly chart.
Cryptocurrency #5:XRDUSD
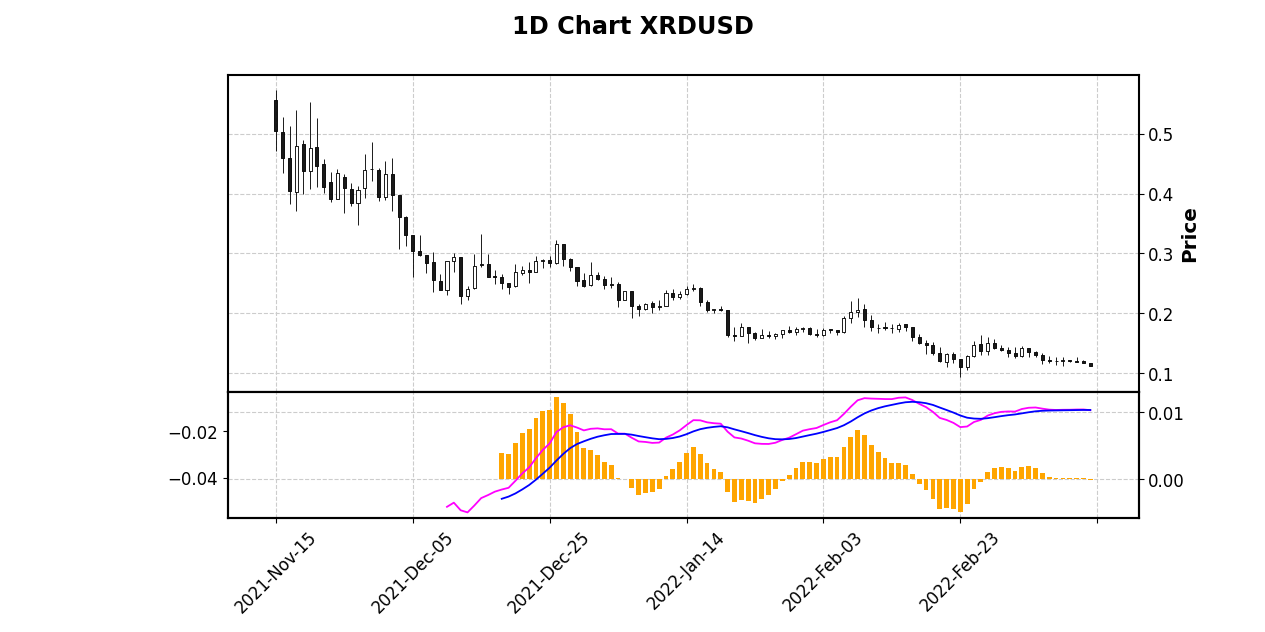
Examining the Moving Average Convergence Divergence (MACD) for XRDUSD, the signal line crossed below the MACD Line and the MACD Histogram crossed below the Zero Line in the previous trading day on the daily chart. This is a bearish signal, especially when combined with an downward price trend.
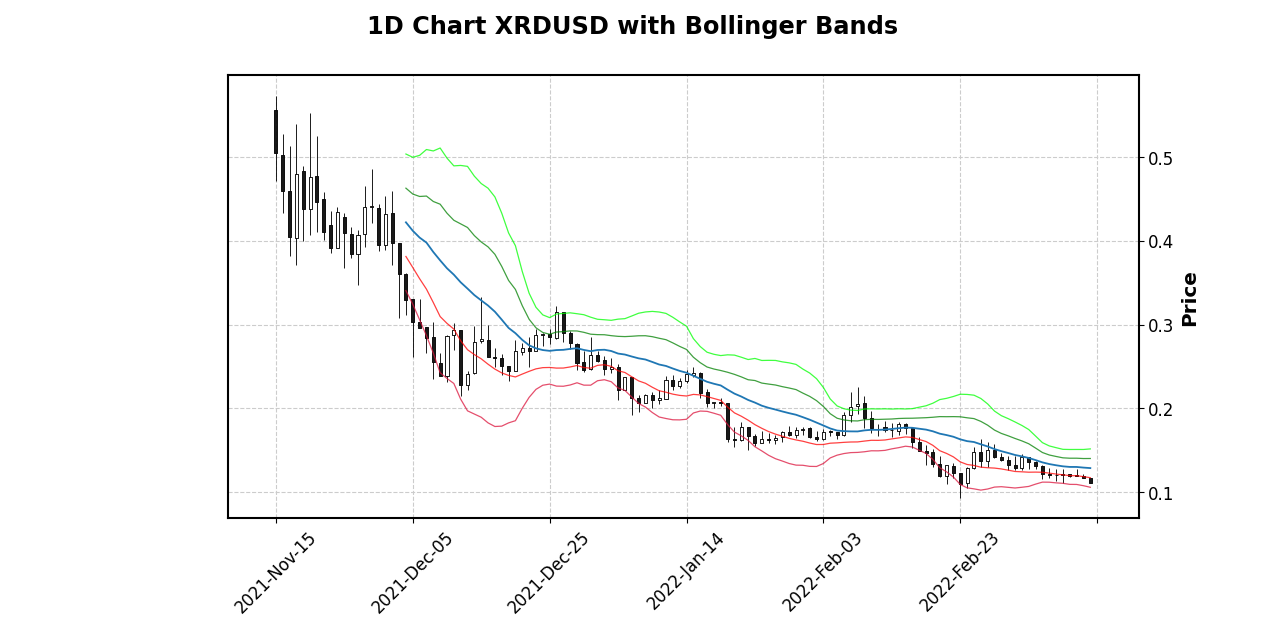
Right now, the daily trend is an downswing and the Bollinger Bands help confirm it as the price is nicely contained within 1-2 Standard Deviation levels below the mean.
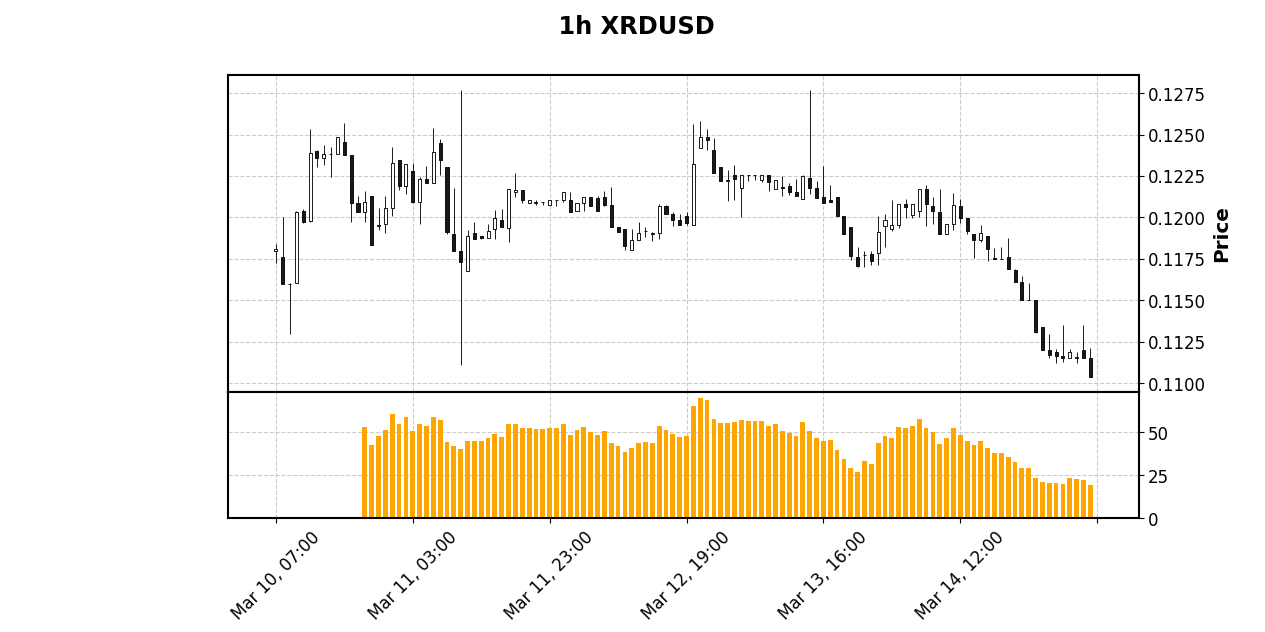
The hourly chart of XRDUSD has the Relative Strength Index (RSI) dropping below 25 in the previous trading hour, which indicates that the cryptocurrency is oversold. This is commonly used in conjunction with other indicators to confirm a possible situation where one would go long on this currency pairing or take profits on a short position.
Cryptocurrency #6:XSNUSD
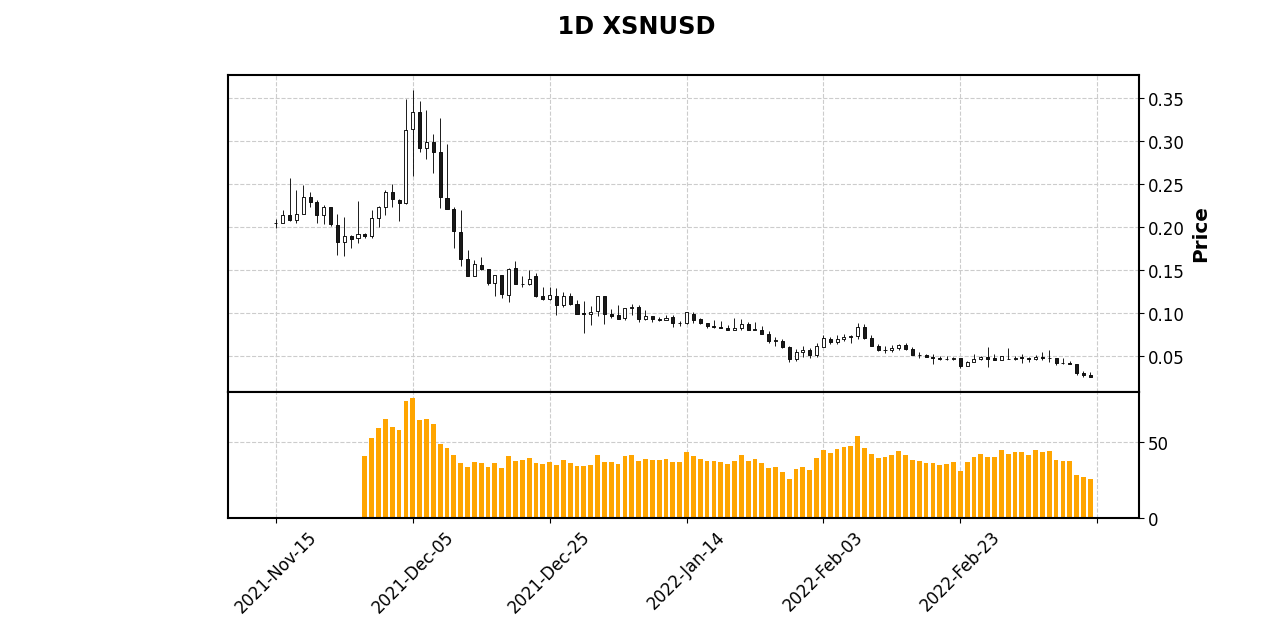
The Relative Strength Index (RSI) on a 14 period measurement on a daily chart, which means 14 trading days are considered in the indicator's findings, shows us that XSNUSD is in an oversold state. Criteria differ as far as what would be considered oversold, some have it at below 20 and others have it at below 30, in these reports, the decision is to compromise in the middle at 25. What does it mean to be in an oversold state? It means that the price action has reached a point of bearish exhaustion according to the RSI and there's a possible opportunity for buyers of this crypto-currency pair or profit-takers in short positions.
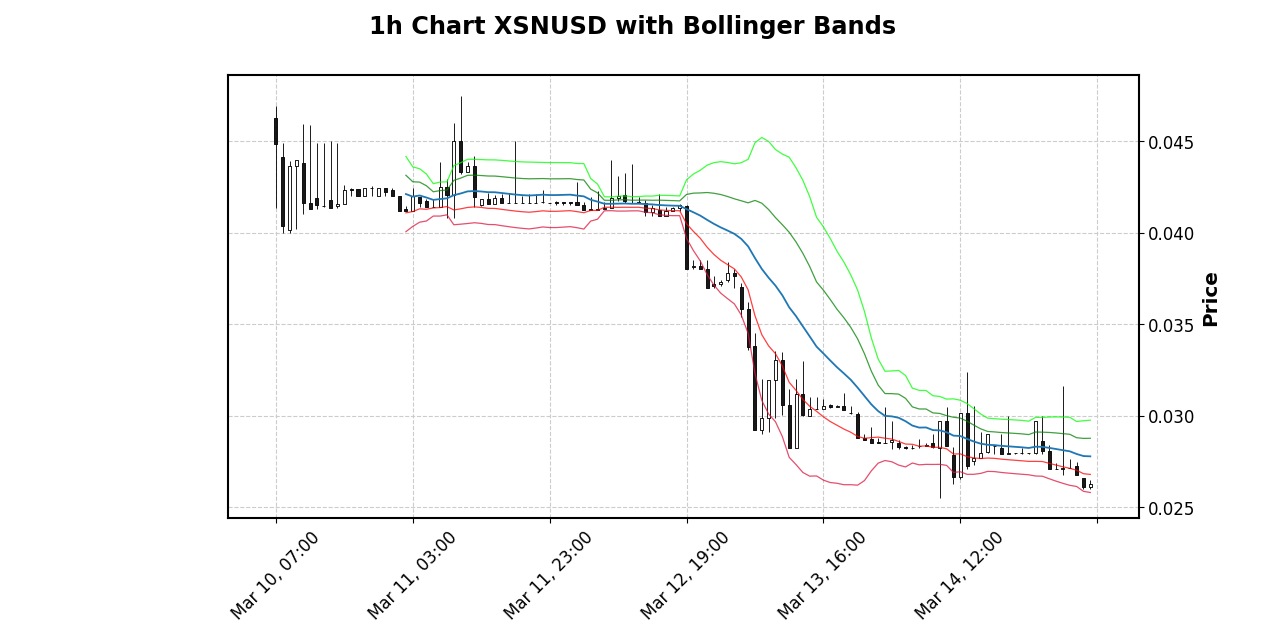
Right now, the hourly trend is an downswing and the Bollinger Bands help confirm it as the price is nicely contained within 1-2 Standard Deviation levels below the mean.
0
0
0.000
Congratulations @coincharting! You have completed the following achievement on the Hive blockchain and have been rewarded with new badge(s):
Your next target is to reach 50 replies.
You can view your badges on your board and compare yourself to others in the Ranking
If you no longer want to receive notifications, reply to this comment with the word
STOPSupport the HiveBuzz project. Vote for our proposal!
Link to the previous post
Copying and pasting previous posts or significant parts of them could be seen as fraud when:
Fraud is discouraged by the community and may result in the account being Blacklisted.
Please refrain from copying and pasting previous posts going forward.
If you believe this comment is in error, please contact us in #appeals in Discord.
There's definitely an error here, let's discuss this matter in Discord.