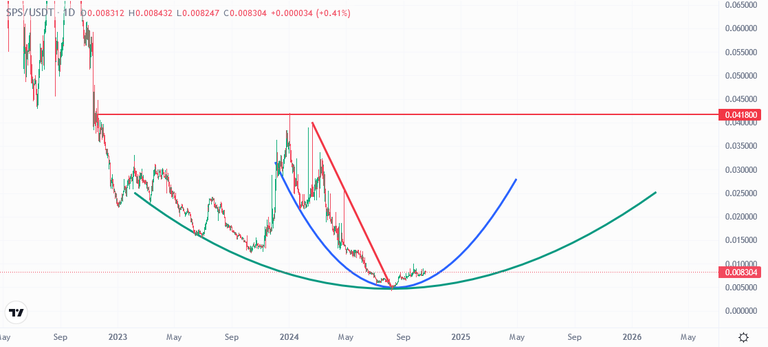
There are Bowl Pattern on SPS Price Chart
SPS price chart has lots of bowl patterns. It is very good to see these pattern that can be the proof of surpass the bottoms. There are big 2 bowl pattern on SPS price chart coming from the beginning of 2023 and 2024.
Here you can see daily chart of SPS. I drew it as blue and green bowls. Even SPS price went down very fast from 0,04 USD to 0,003 USD, It can not recovery the loses as going down. SPS price need to touch blue bowl pattern as a support and It may be supported and go up very fast after this touch.
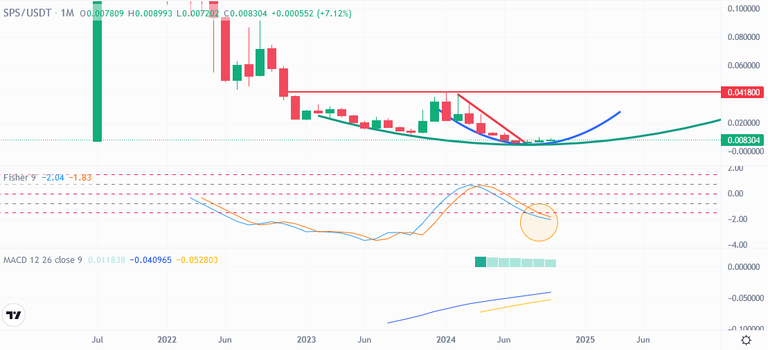
Here you can see monthly chart of SPS. Fisher Indicator is on the bottom. It is very nice to see the bottom. You can see what happaned after reversing from the bottom. SPS Price weent up from 0,01 USD to 0,04 USD in short time. We may see huge price up after Fisher Indicator reversed from the bottom.
MACD Indicator is going up slowly, It will be very nive to see MACD Indicator above 0 level.
So, I am very bullish for SPS price chart. We should see at least 5x profit from here. 0,04 USD is great resistance. We will enter mega bullish trend after breaking up this resistance.
We will see..
Posted Using InLeo Alpha