Hive Price Broke up Great Resistance on RSI Indicator
There was great downtrend line on RSI Indicator. Hive price broke up this great resistance. I shared a few analysis about this downtrend lines on Hive price chart and It is broken up finally.
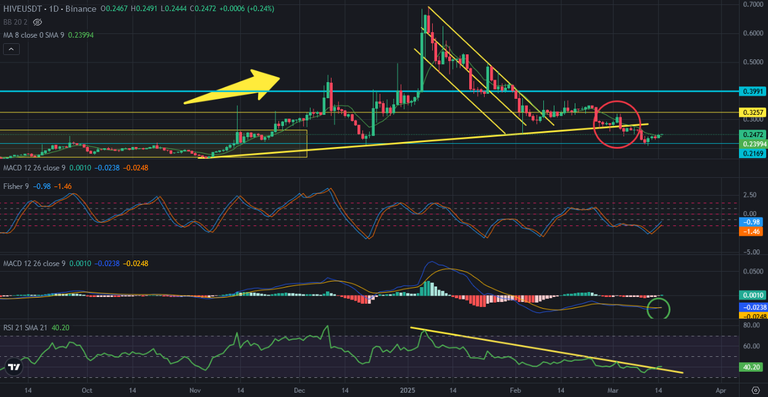
Here you can see daily chart of Hive price and the indicator. MACD Indicator reversed up from the bottom. RSI Indicator is broken up. Fisher Indicator reversed up from the bottom. It is time to go up in daily chart of Hive. Hive price supported by the middle line of depression zone. I shared a post and said It may be the bottom of Hive price after 0,70 USD price correction. Price correction may be completed after touching this support level.
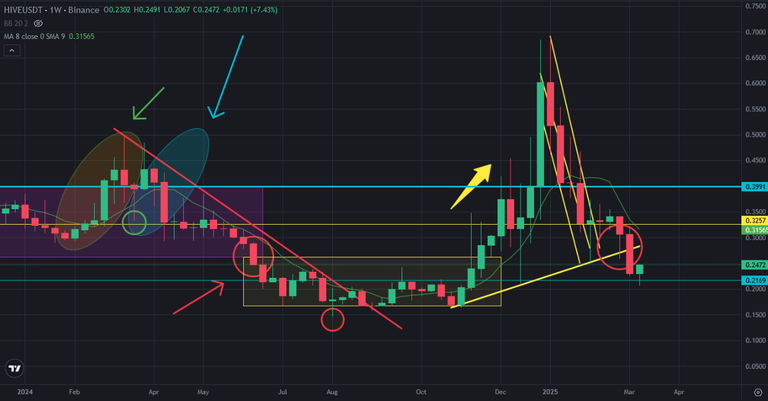
Here you can see weekly chart of Hive. Hive price has 7 red candles in last 10 weeks. 3/7 green/red ratio may bring us good days. It is normal to see 3/7 ratio in last 10 weeks. Price correction may be completed. It is also good to see green weekly candles at the last week of 10-week series..
There are lots of signals that show us we may be at the end of price correction.
As I said, there are lots of signals that show us the end of downtrend. We may see good days.
I shared a few posts and said we may enter bullish trend until the end of March or the beginning of April.
We will see..
Posted Using INLEO