Hive Broke up Great Resistance for Midterm
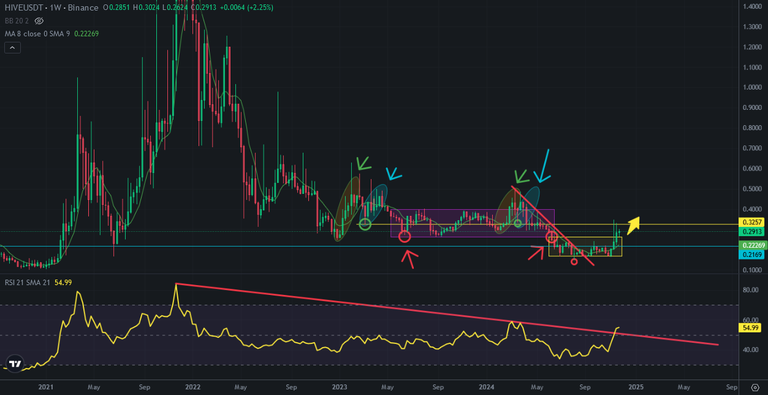
Hive broke up great resistance on weekly chart. It is a resistance for midterm Hive destroyed one of great resistance. Here you can see weekly chart of Hive and RSI Indicator. There is downtrend line on RSI Indicator on weekly chart. Hive broke up this resistance in last week. There is a few resistance on Hive price chart. First one is the middle line of consolidation zone where Hiver spent 1 year in it.
It is one of great resistance. We can say that It is as an average for Hive price. So, Hive price is still in discount. The average of Hive price from the beginning is more than 0,40 USD.
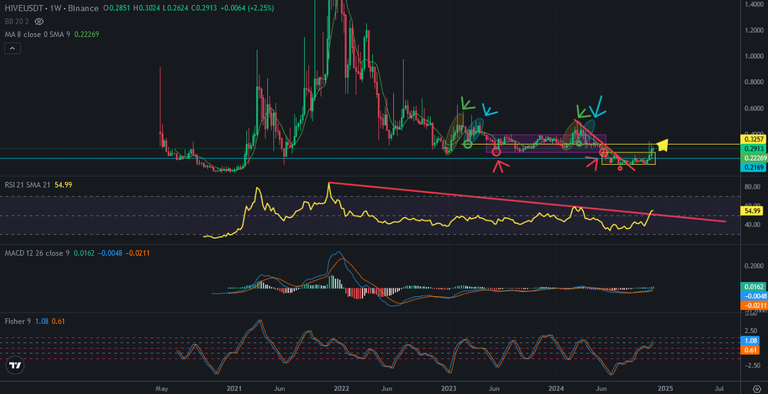
Here you can see the indicators of Hive price chart. MACD Indicator is still at below 0 level. You can see what happened after breaking up 0 level in 2021. This is why I say that It is still discounted!
Fisher Indicator is going up but it is not on the top! So, Hive has lots of weeks on bullish season.
As I said, It is still at discounted level. Hive has great potential. It will be the star of Web3.0 hype as 2021.
I am still picking up Hive from disounted level.
We will see..
Posted Using InLeo Alpha

