Bitcoin Price Should Touch the Top Line of Bollinger Bands in next Week
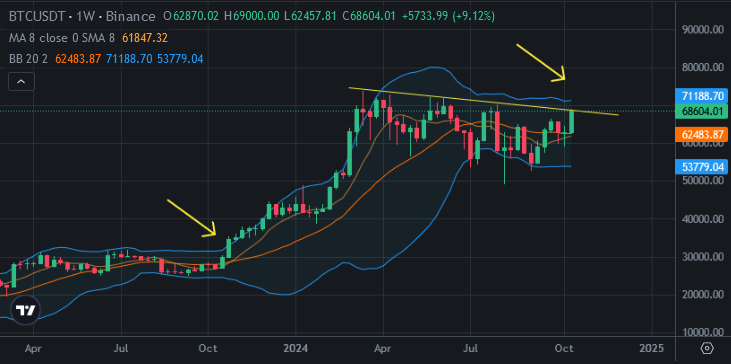
Bitcoin price touched to downtrend line coming all yime high. It is 4th times, it resisted Bitcoin price. Bitcoin should break up this downtrend line and touch the top line of bollinger bands in weekly chart.
Here you can see weekly chart of Bitcoin. There is bullish green weekly candle in Bitcoin price chart. If we see green candle in next week, Bitcoin price will touch the top line of Bollinger Bands. You can see what happened after touching the top line of Bollinger Bands in weekly chart. I drew it.
So, next week is so important!
Here you can see daily chart of Bitcoin. Tomorrow, Bitcoin will touch the resistance on MACD Indicator. It may resist Bitcoin price! I shared a post yesterday I was waiting for price correction on Bitcoin price chart due to this resistance.
So, tomorrow is so important. We may see high volatility on Bitcoin price chart in next week!
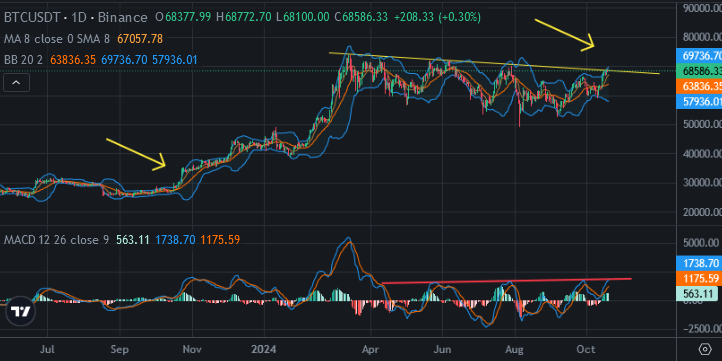
Price and MACD Indicators are in pressure by resistance. We will see what will be happened in next week. If they are broken up, we will see all time high in next week!
Posted Using InLeo Alpha
Congratulations @chorock! You have completed the following achievement on the Hive blockchain And have been rewarded with New badge(s)
You can view your badges on your board and compare yourself to others in the Ranking
If you no longer want to receive notifications, reply to this comment with the word
STOPWaiting for 57 :)
57K may be out of our plan. It reversed from 59K while we were waiting 57K.
I shaed a post about price drop and I just started..
So buy now ?