Bitcoin Price Resisted by the Middle Line of Bollinger Bands
After Bitcoin price went down fast, it is trying to reverse up. I shared lots of analysis about Bitcoin price chart and said I was waiting for price reversing up until end of March or the beginning of April. I am sure that we will see good days.
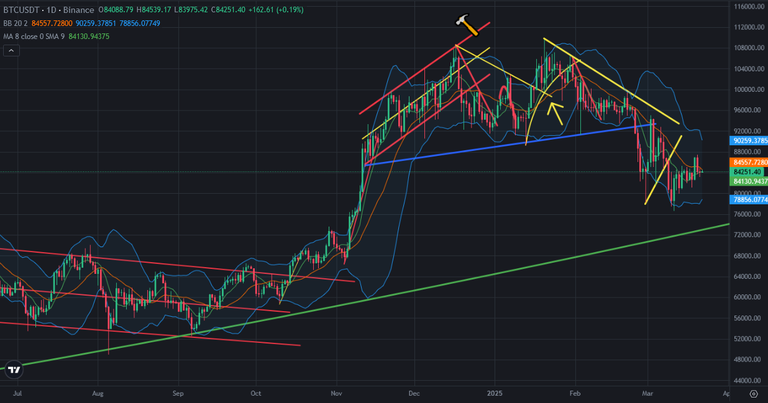
Bitcoin price resisted by the middle line of Bollinger Bands. It is one of the last resistance of Bitcoin price chart before reversing up.
Here you can see daily chart of Bitcoin. The middle line of Bollinger Bands resisted Bitcoin price 3 times after touching 108K USD. This is the 4th.
Here you can see the indicators on daily chart of Bitcoin. There were downtrend lines on Bitcoin price chart and They are broken up. Major Indicators reversed up from the bottom. It is so possible to see reversing up on price.
After seeing the breaking up of the middle line of Bollinger Bands, we will see price pump on Bitcoin price chart.
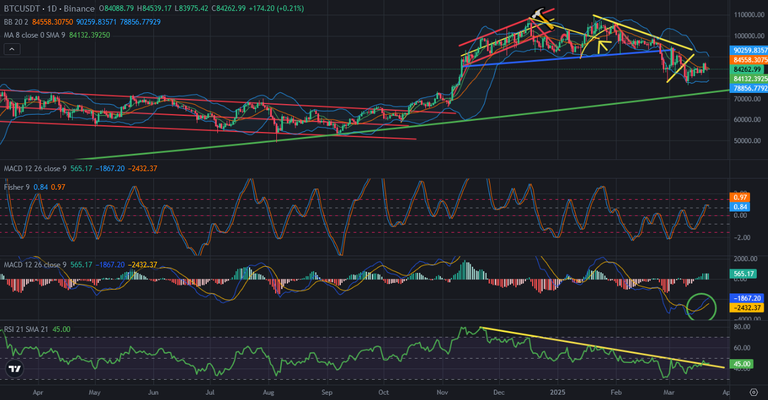
So, the middle line of Bollinger Bands will be broken up in a few days and we will see price pump and bullish trend on Bitcoin price chart in a few weeks.
We will see..
Posted Using INLEO