Bitcoin Broke Up the Resistance Coming From All Time High
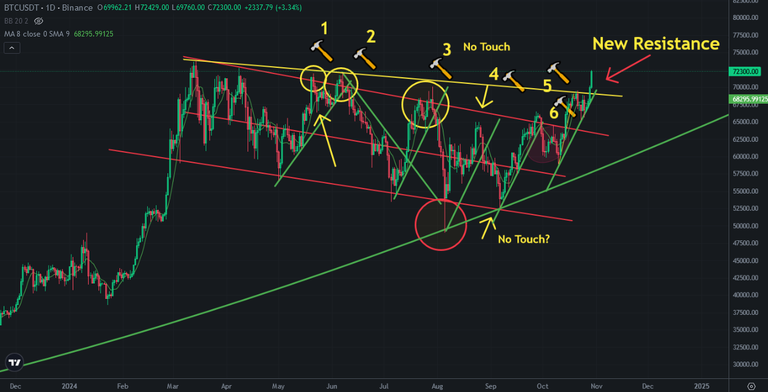
Today Bitcoin price broke up the resistance coming from all time high 73K USD. Bitcoin price is trying to break up 73K USD to touch new all time high. There is only one great resistance on Bitcoin price chart. MACD Indicator reversed up and trying to break up great resistance.
Here you can see daily chart of Bitcoin price. Bitcoin should break up 73K USD level. If not we may see double top on Bitcoin price chart. 69K USD is the level of downtrend line coming from all time high. Bitcoin price may reverse to touch this resistance to make it supoort line. Retest may be coming soon.
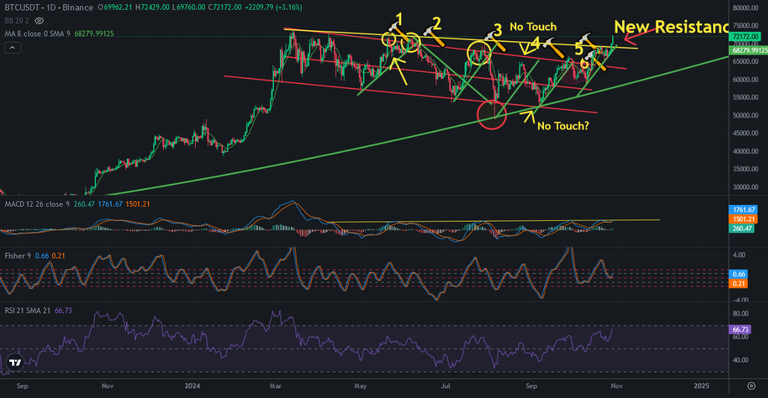
Here you can see MACD Indicator on daily chart of Bitcoin. MACD will touch great resistance today. Tomorrow will be important. If Bitcoin break up the resistance on MACD Indicator, we will enter mega bullish season.
If not, we will wait..
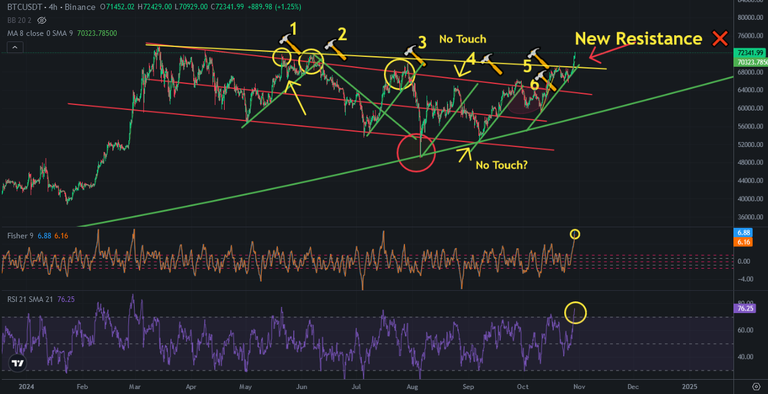
Here you can see 4-hour chart of Bitcoin price. Fisher Indicator is on the sky. It needs to revese down. RSI Indicator is also on the sky. It is at overbought level. We may see price correction in a few hours. This is why I said tomorrow is important. If we see price correction, Bitcoin price may go down to touch downtrend line as a support. It may complete retest. It may be great chance to pick up crypto before maga altcoin season.
I think that we will see price correction in 24 hours. ıt may be hard or soft.
We will see..
Posted Using InLeo Alpha


