Bearish Bottom Similarity Between 2018-2022 in Bitcoin Price Chart
Lots of people think that Bitcoin price will go down to 10K or new bottom in 2022. I dont think like this. We may be on 2nd bottom of 2022 and It may be the last bottom of bearish season...
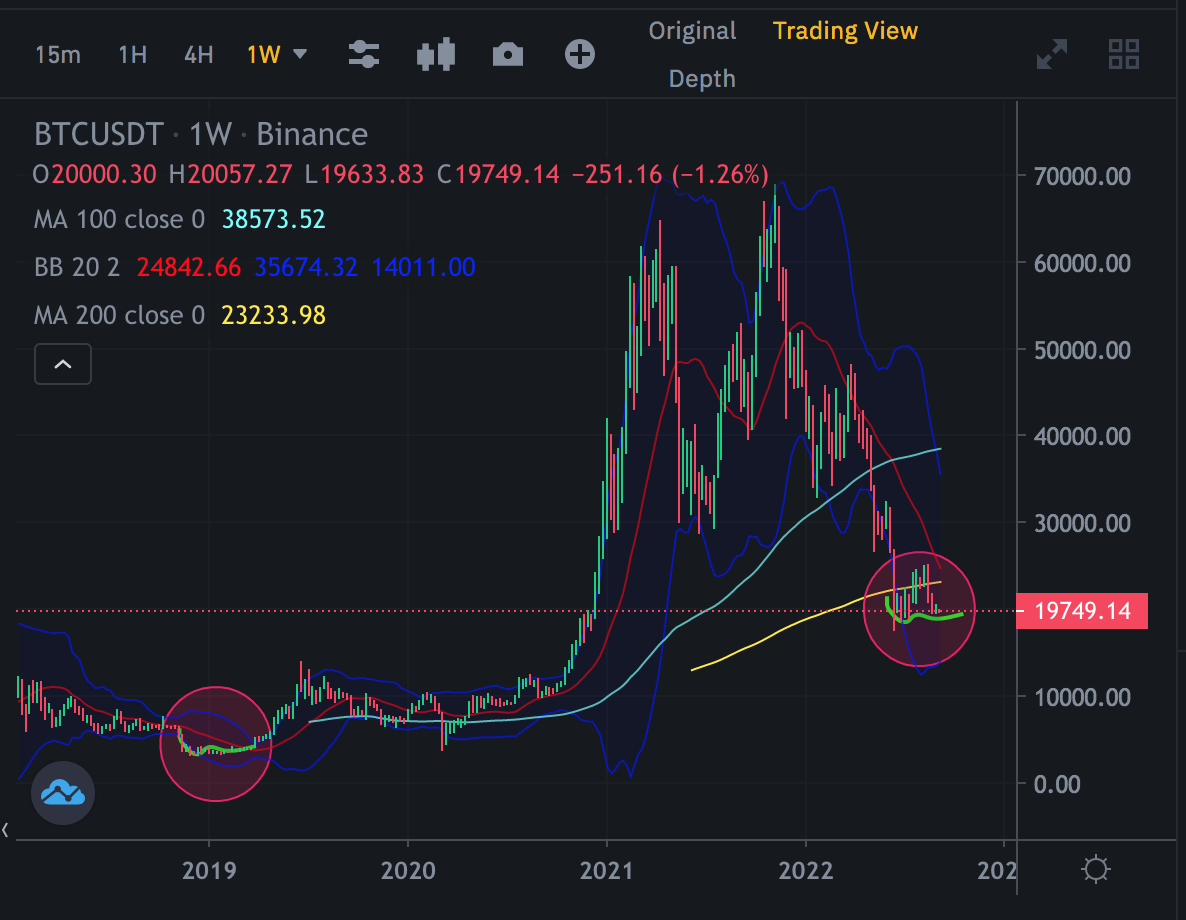
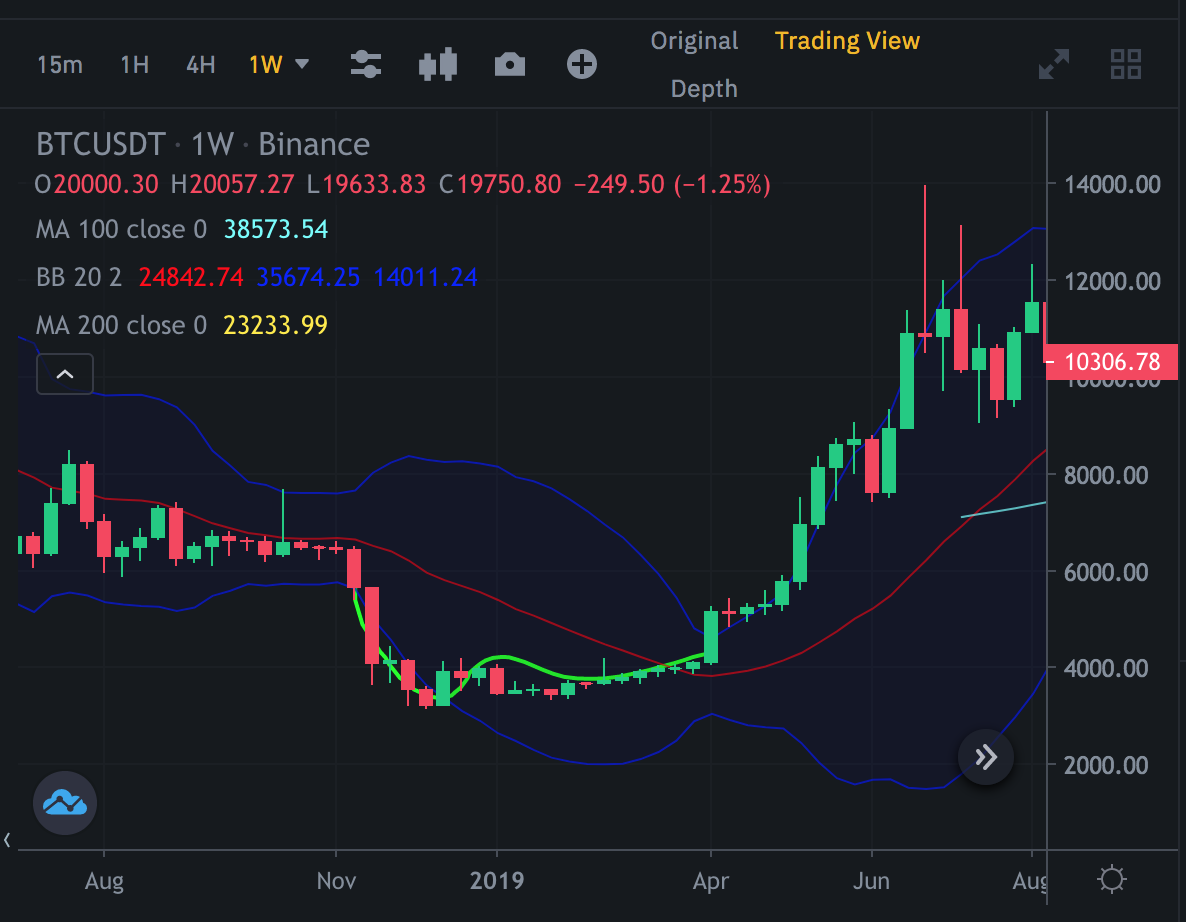
There are lots of similarities between 2018 & 2022.
As you see weekly chart of Bitcoin below, Bitcoin may try to draw same pattern. So, It may take a few weeks in this level.

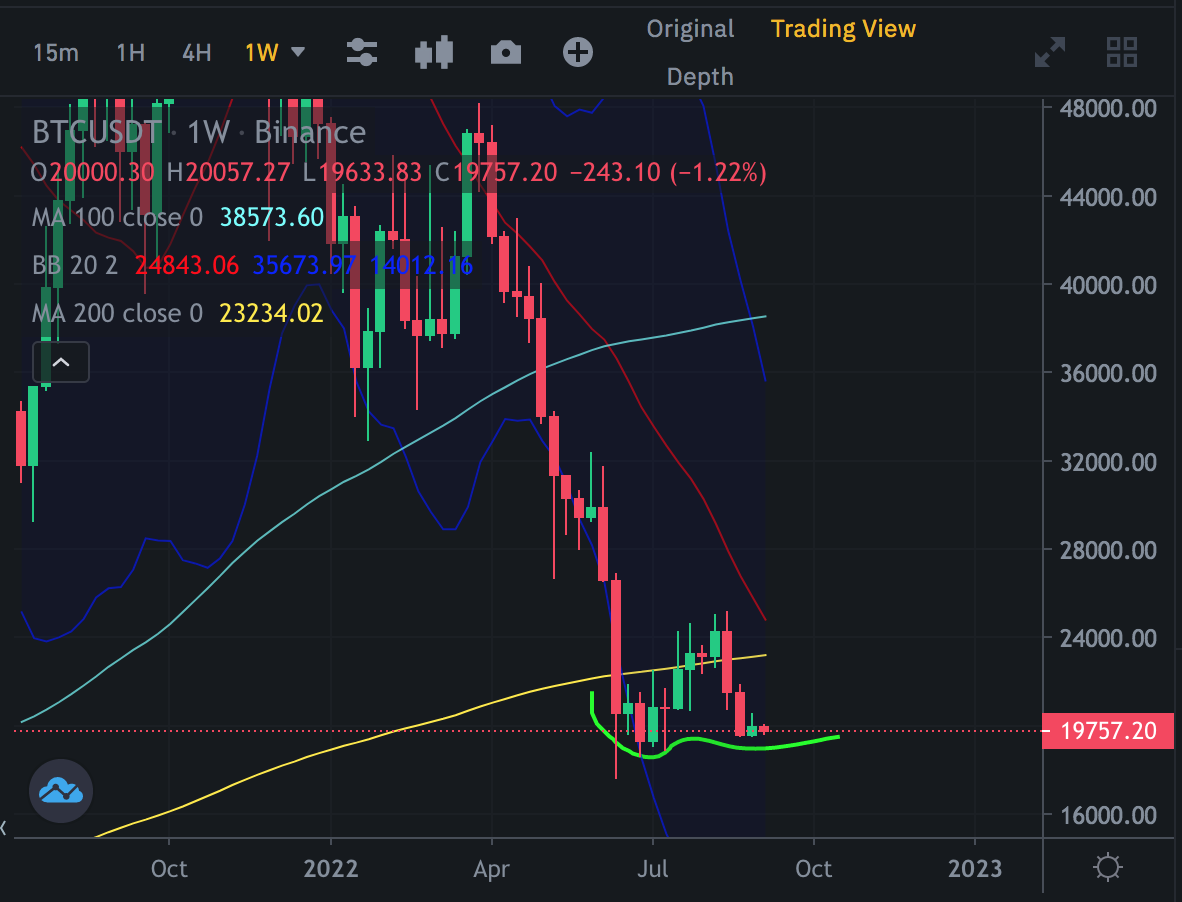
I draw the moves of Bitcoin with green line. There is high low after dead cat pump..

When I copy and paste same move in today, You can see same pattern. It may take a few weeks...

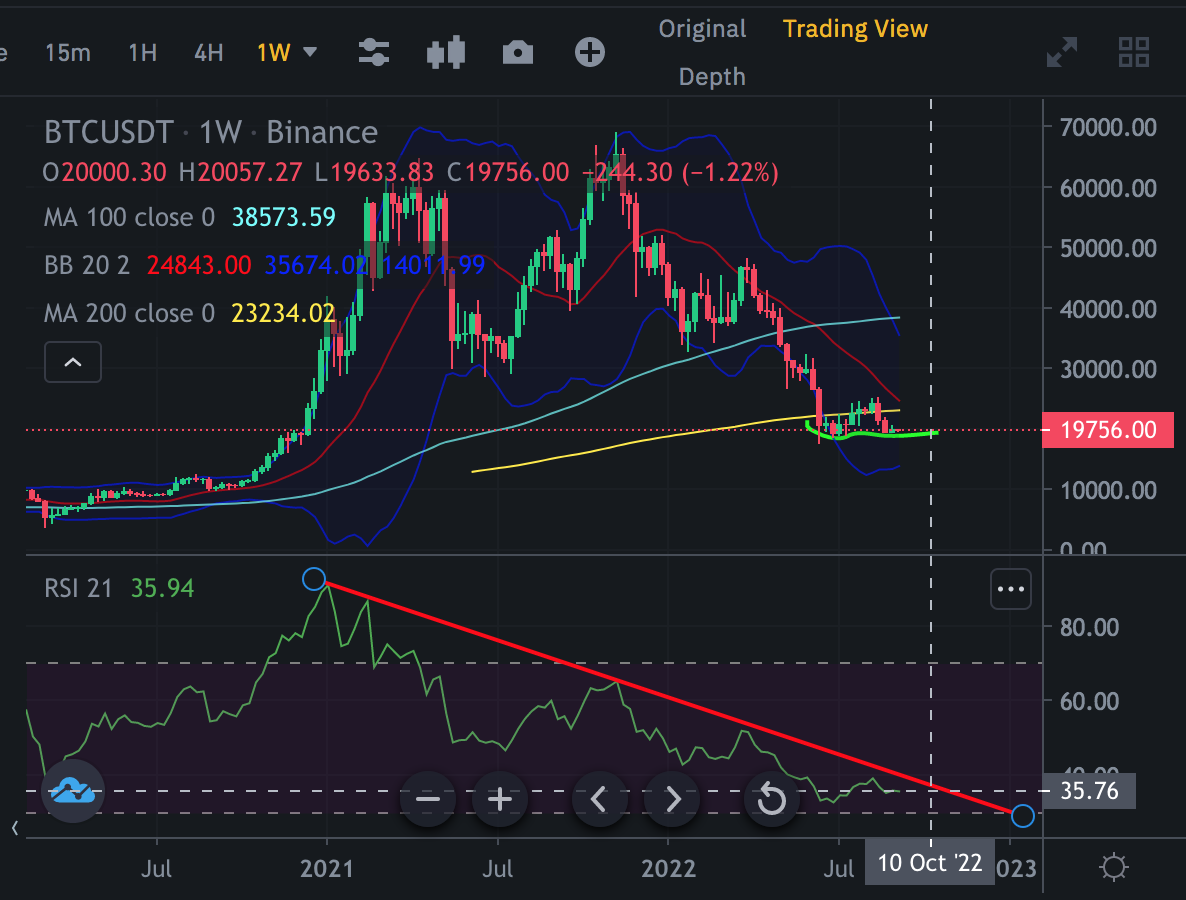
I said lots of times that September may be the last month of bearish season and We may enter bullish season in October.
There are lots of signal on indicators and RSI Indicator show us same date..

If Bitcoin price doesnt break down 18500 USD, my thesis will be correct.
We will see...
Posted Using LeoFinance Beta
View or trade
BEER.Hey @chorock, here is a little bit of
BEERfrom @pixresteemer for you. Enjoy it!Learn how to earn FREE BEER each day by staking your
BEER.Congratulations @chorock! You have completed the following achievement on the Hive blockchain and have been rewarded with new badge(s):
Your next target is to reach 1700 posts.
You can view your badges on your board and compare yourself to others in the Ranking
If you no longer want to receive notifications, reply to this comment with the word
STOPTo support your work, I also upvoted your post!
Check out the last post from @hivebuzz:
I noticed that a few days ago as well. It looks like the price of BTC is making a double bottom formation.