Hive Financial Statistics – 2024.10

Welcome to the monthly financial report about the Hive blockchain.
All the information presented in this report is based on the data collected from the blockchain until 2024-10-31 midnight UTC. This report aims to provide you with a clear view of what is happening on the Hive blockchain.
 Este post está traducido al español - aquí
 Dieser Beitrag ist ins Deutsche übersetzt - hier
 Une version en français de ce post est disponible - ici
1. Price
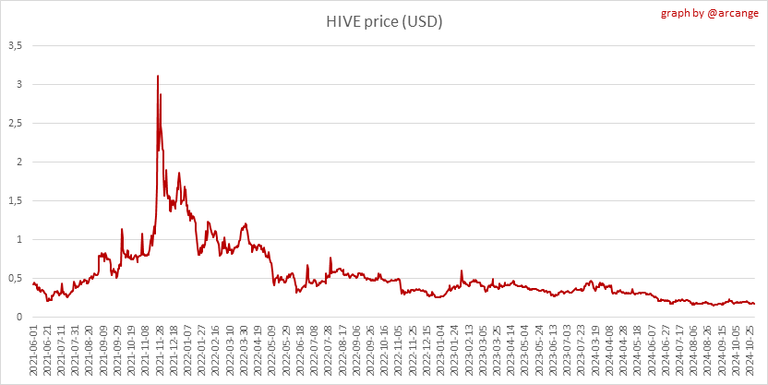 | 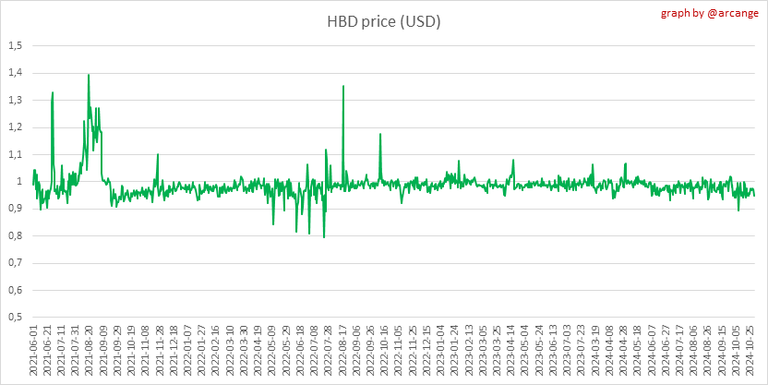 |
These graphs show the evolution of prices in USD for HIVE and HBD.
2. Supply

This graph shows the evolution of HIVE virtual Supply. The virtual supply is the sum of HIVE supply (liquid and staked HIVE) and HBD supply (converted into HIVE).
The graph also displays the debt ratio (HBD supply / HIVE virtual supply). Keep in mind that since hardfork 24 funds in the treasury (@hive.fund HBD balance) don't count towards the HBD debt ratio.
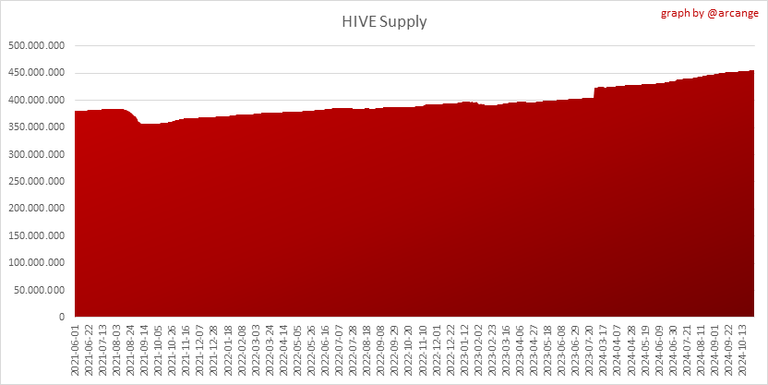 | 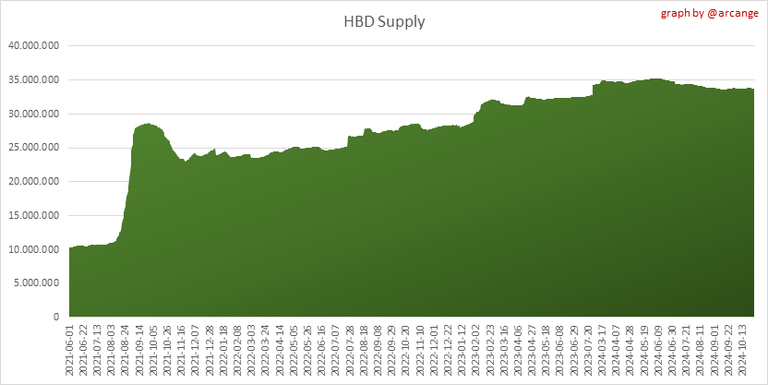 |
These graphs show the evolution of the HIVE Supply (both liquid and staked) and the HBD supply.
 | 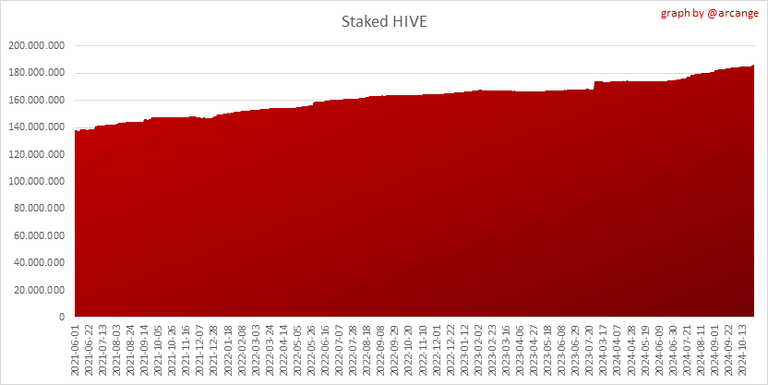 |
These charts show the evolution of the liquid HIVE and the staked HIVE (Hive Power).
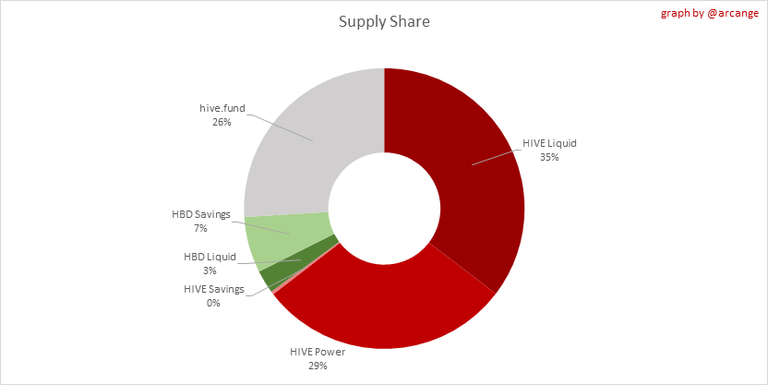
This graph shows the overall Hive tokens distribution.
3. HBD Savings
| Account | Deposit | Account | Withdrawal |
|---|---|---|---|
| @johnhtims.life | 5,000.000 HBD | @scamforest | 3,600.000 HBD |
| @roundbeargames | 2,138.738 HBD | @dandays | 3,150.078 HBD |
| @spiritsurge | 2,000.000 HBD | @lazy-ninja | 2,000.000 HBD |
| @davidchaussure | 600.000 HBD | @d-company | 850.000 HBD |
| @travelgirl | 592.224 HBD | @coinlogic.online | 500.000 HBD |
| @toofasteddie | 384.301 HBD | @mup | 500.000 HBD |
| @upsetfix | 350.000 HBD | @kamilla19 | 487.233 HBD |
| @harbiter | 319.002 HBD | @runicar | 301.588 HBD |
| @queenofmonsters | 214.658 HBD | @monochiralmonkey | 300.000 HBD |
| @eddyss | 145.000 HBD | @mango-juice | 235.500 HBD |
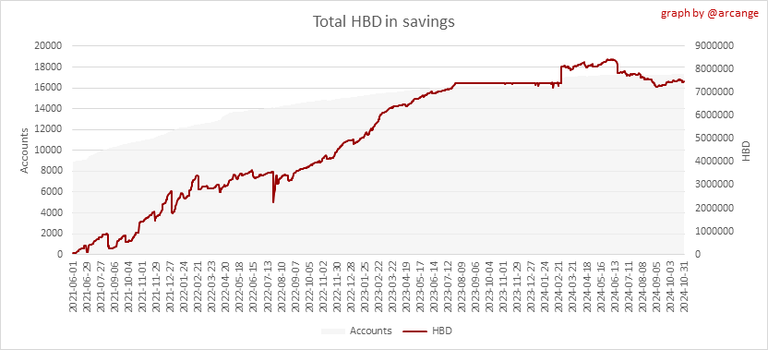
This graph shows how much and how many accounts store HBD in savings. The table below shows the topmost HBD deposits and withdrawals of the day.
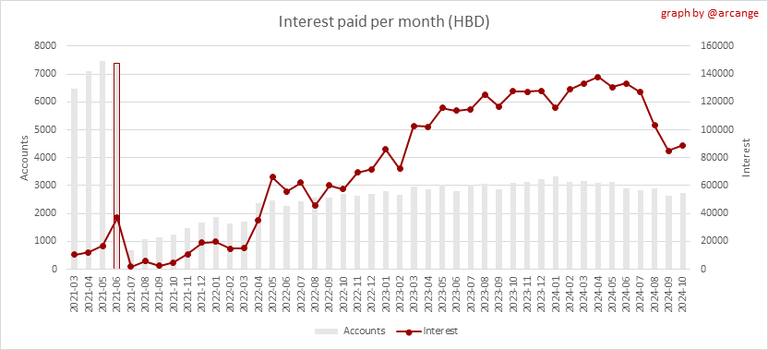
Note: As of 2021-06-30 (HF25) interest is only paid for HBD which are stored in savings.
This chart shows the amount of interest paid each month for holding HBD and how many accounts received such interest.
4. Balances
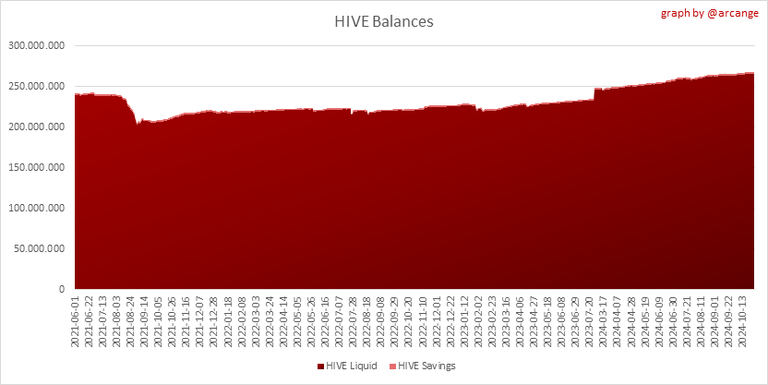
This graph shows the number of HIVE, both liquid and in savings, held by all accounts.

This graph shows the number of HBD, both liquid and in savings, held by all accounts. It also displays the amount of HBD stored in the Decentralized Hive Fund (DHF).
5. Conversions
Note: As a reminder, conversion requests are only finalized after 3 days. It is only then that it is known exactly how many HIVE were burned in return for the HBD received at the time of the conversion request.
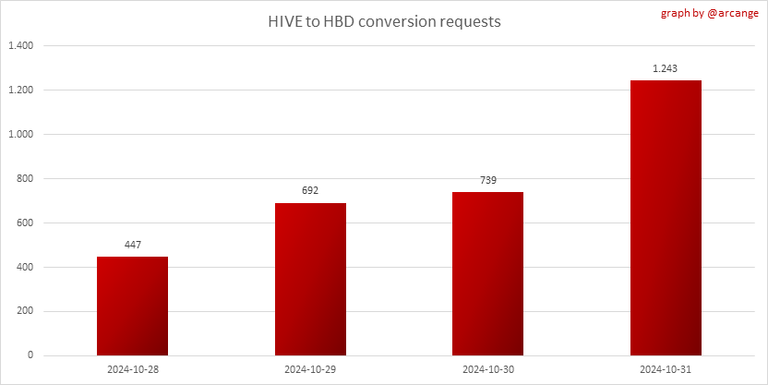
This graph shows the number of HIVE collateralized due to requests to convert HIVE to HBD over the past few days.
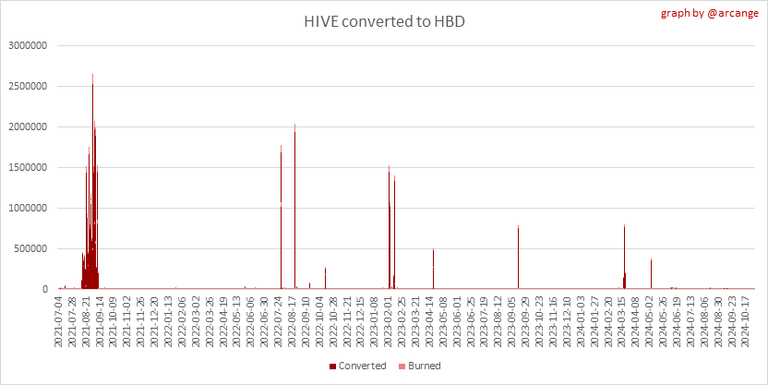 |  |
These graphs show the number of HIVE effectively used by the conversion process (HIVE converted and 5% HIVE fee which is burned) each day and month when requests to convert HIVE to HBD have been finalized.
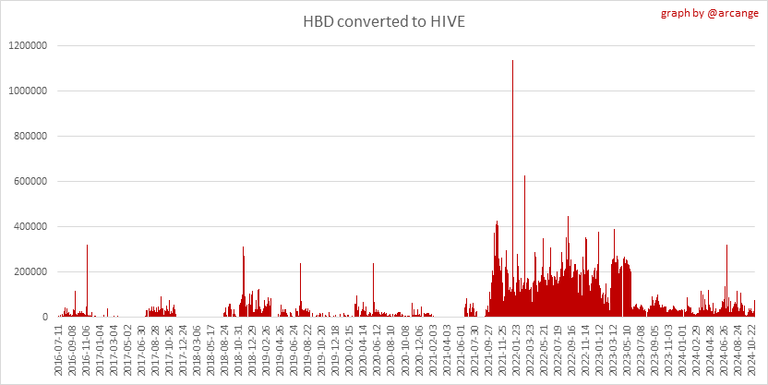 | 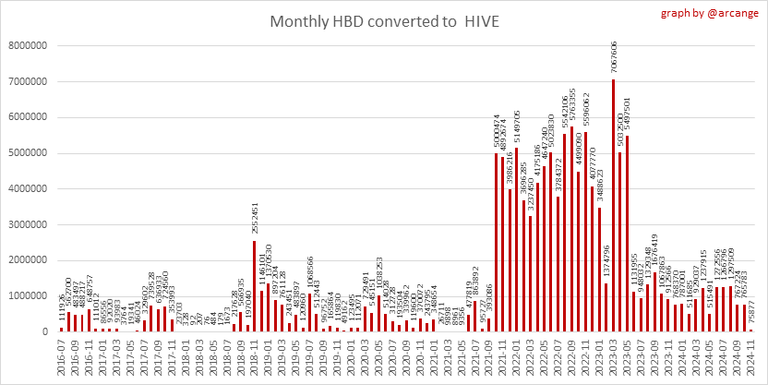 |
These graphs show the number of HBD burned, each day and each month, following requests to convert HBD to HIVE.
6. Powerup and Powerdown
| Date | Account | Amount |
|---|---|---|
| 2024-10-31 11:55:45 | @aliento | 22,157.403 HIVE |
| 2024-10-31 11:15:51 | @davedickeyyall | 13,000.977 HIVE |
| 2024-10-31 09:49:36 | @leeendah | 4,411.054 HIVE |
| 2024-10-31 01:37:15 | @omarcitorojas | 4,274.057 HIVE |
| 2024-10-31 04:32:54 | @in2itiveart | 3,949.740 HIVE |
| 2024-10-31 02:11:54 | @omarrojas | 2,600.255 HIVE |
| 2024-10-31 07:19:39 | @warpedpoetic | 1,758.416 HIVE |
| 2024-10-31 08:56:57 | @gamingphoto | 1,743.657 HIVE |
| 2024-10-31 08:40:06 | @kedi | 1,700.201 HIVE |
| 2024-10-31 06:32:21 | @splinterboost | 1,545.500 HIVE |
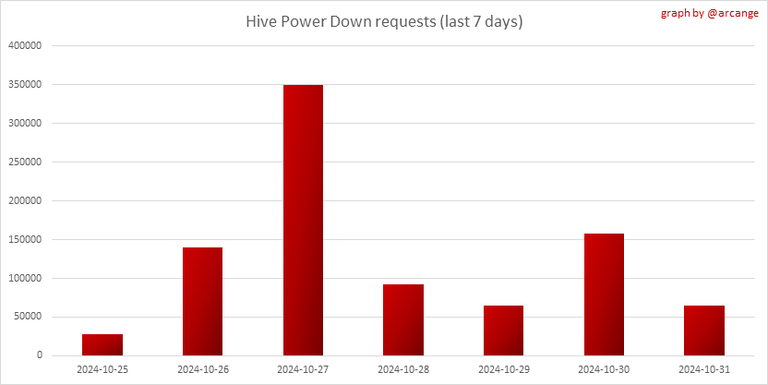
This graph and table show the amount of powerdown initiated over the last 7 days, and the largest initiated on this day.
| Account | Powerup | Account | Powerdown |
|---|---|---|---|
| @jarvie | 5,000.000 HIVE | @ocdb | 12,599.023 HIVE |
| @jeremiahcustis | 2,317.948 HIVE | @prinzvalium | 6,028.655 HIVE |
| @vaultec | 1,243.193 HIVE | @arcadeph | 4,745.795 HIVE |
| @gifu | 1,000.000 HIVE | @roelandp | 3,358.004 HIVE |
| @hosgug | 636.678 HIVE | @steempeak | 3,248.234 HIVE |
| @duo-curator | 507.846 HIVE | @ocd-witness | 3,054.652 HIVE |
| @otsoak | 424.145 HIVE | @eonwarped | 2,131.971 HIVE |
| @gallatin | 400.000 HIVE | @amirl | 1,623.953 HIVE |
| @carolynstahl | 278.964 HIVE | @risingstargame | 1,561.229 HIVE |
| @arahman | 218.990 HIVE | @catwomanteresa | 1,239.878 HIVE |
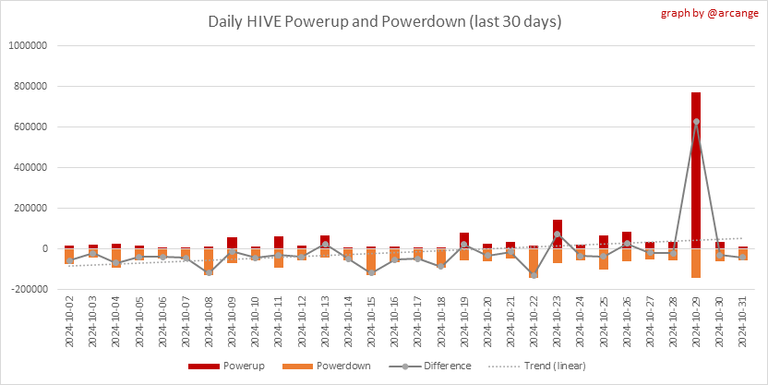
This graph shows the daily HIVE power-up, power-down, and the resulting variation over the last 30 days. The table shows the topmost power-ups and power-downs of the day.

This graph shows the monthly HIVE power-up, power-down and the resulting variation.
Values for the last 3 months
| Period | Powerup | Powerdown | Difference |
|---|---|---|---|
| 2024-10 | 1,852,552.000 | 2,314,146.000 | -461,594.000 |
| 2024-09 | 2,258,774.000 | 1,912,920.000 | 345,854.000 |
| 2024-08 | 2,281,786.000 | 2,178,229.000 | 103,557.000 |
7. Transfers
 | 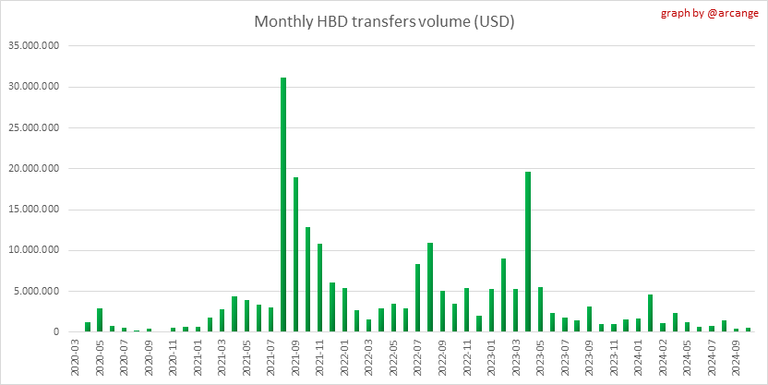 |
These graphs show the volume (in USD) of HIVE and HBD transferred between accounts.
8. Exchanges
 | 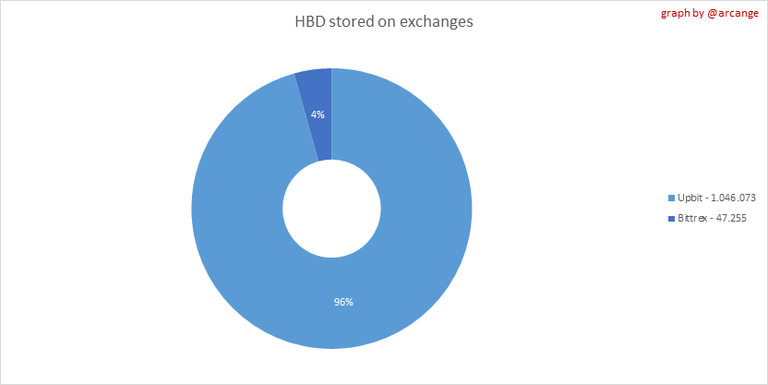 |
These graphs show the amount and distribution of HIVE and HBD stored on the exchanges where they are listed.
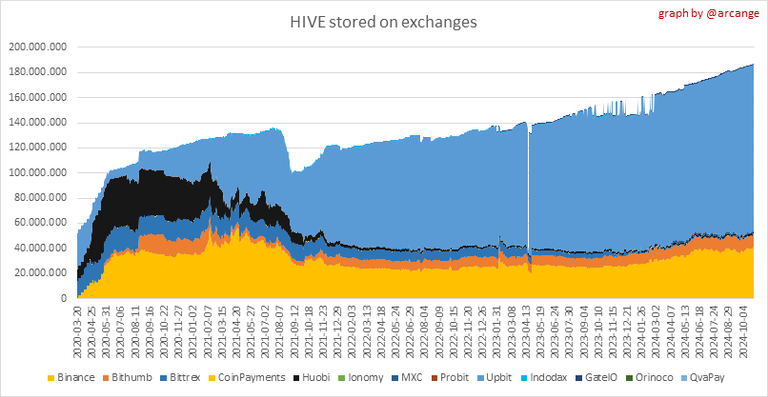 | 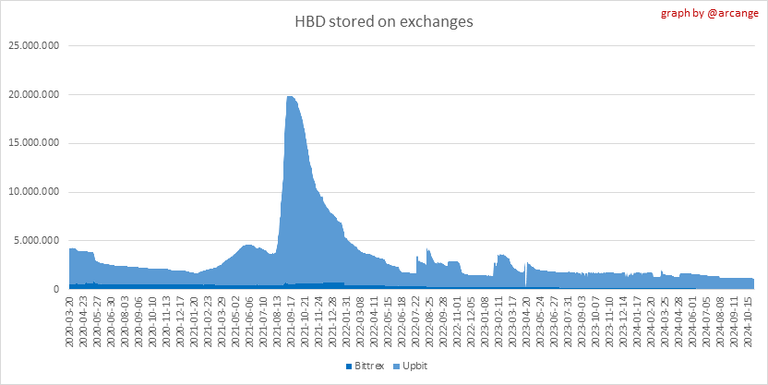 |
These graphs show the daily evolution of HIVE and HBD stored on the exchanges where they are listed.
I hope you find those stats useful. If you would like to see additional stats, feel free to drop me a comment. Your feedback is more than welcome.
Thanks for reading.


!BEER
View or trade
BEER.Hey @arcange, here is a little bit of
BEERfrom @pixresteemer for you. Enjoy it!Learn how to earn FREE BEER each day by staking your
BEER.Woohoo! I made it on a arcange post.
I am withdrawing HBD to power up some more.
Way to go kamilla19! 👍
Thank you dear, I wish you much success.
Gracias estimado, le deseo muchos éxitos.
Gracias @omarrojas,
Yeah, just starting to put some savings as HBD for the future ✌🏻 because I believe in the Hive Blockchain
That's a good strategy @harbiter!
There is great similarities with both supply, the chart is fluctuating i wonder when it will be stable perhaps that is the reason hive is diminished
The fluctuations in the supply charts are common in decentralized blockchain systems, where supply dynamics are influenced by various factors such as market demand, user activity, and economic incentives.
But how does this factors affect hive in anyway is it that hivers witdraw most of their hive tokens or aint doing much hive activities no more that is why price is going down?
If more people are selling than buying, it can drive the price down. Additionally, if there's less activity or engagement on the platform, it might affect demand.
Hmmm i see, very well understood
Very interesting statistics @arcange. Thanks for keeping us updated :)
Thank you Liz
This particular coin will be used as daily commodity in 2025 and beyond. Get it while it is still free. www.minepi.com/zdigital
Congratulations @arcange! You have completed the following achievement on the Hive blockchain And have been rewarded with New badge(s)
Your next payout target is 238000 HP.
The unit is Hive Power equivalent because post and comment rewards can be split into HP and HBD
You can view your badges on your board and compare yourself to others in the Ranking
If you no longer want to receive notifications, reply to this comment with the word
STOPCheck out our last posts:
Interesting analysis, it is good to handle this type of information.
Hey @arcange - apart from doing these regular reports which are useful - what is your personal view about the Hive blockchain in general and its options moving forward? Also around layer 1 / layer 2 initiatives - what you think can be done to improve and finally bring this good chain to a wider audience to attract investors?
Hey @uwelang, thank you for your feedback about my reports.
I believe the Hive blockchain has a solid foundation with all the Layer 1 improvements that have been done recently, but we indeed need a wider audience.
With VSC smart contracts and Lite Accounts coming, we will finally be able to compete with other blockchains.
Layer 2 initiatives should focus on building more diverse dApps. Education and marketing efforts are also crucial to increase awareness.
We need more collaborations with other projects and integrating with other platforms to showcase Hive's potential.