Hive Financial Statistics – 2023.12.27

Welcome to the daily financial report about the Hive blockchain.
All the information presented in this report is based on the data collected from the blockchain until 2023-12-27 midnight UTC. This report aims to provide you with a clear view of what is happening on the Hive blockchain.
 Este post está traducido al español - aquí
 Dieser Beitrag ist ins Deutsche übersetzt - hier
 Une version en français de ce post est disponible - ici
1. Price
 |  |
These graphs show the evolution of prices in USD for HIVE and HBD.
2. Supply

This graph shows the evolution of HIVE virtual Supply. The virtual supply is the sum of HIVE supply (liquid and staked HIVE) and HBD supply (converted into HIVE).
The graph also displays the debt ratio (HBD supply / HIVE virtual supply). Keep in mind that since hardfork 24 funds in the treasury (@hive.fund HBD balance) don't count towards the HBD debt ratio.
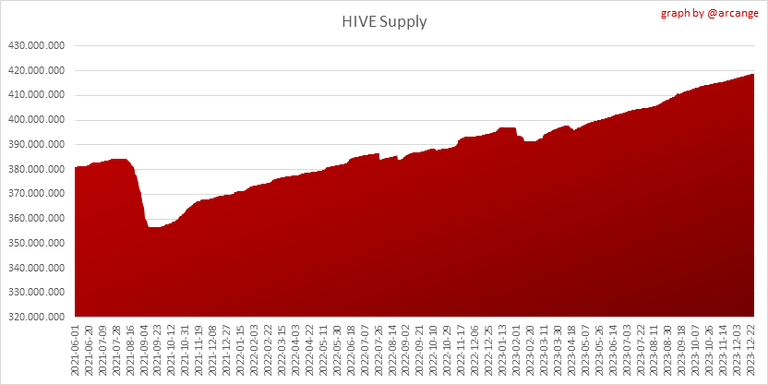 |  |
These graphs show the evolution of the HIVE Supply (both liquid and staked) and the HBD supply.
 |  |
These charts show the evolution of the liquid HIVE and the staked HIVE (Hive Power).

This graph shows the overall Hive tokens distribution.
3. HBD Savings

| Account | Deposit | Account | Withdrawal |
|---|---|---|---|
| @namelessnonsense | 998.748 HBD | @oflyhigh | 5,686.662 HBD |
| @dutchchemist | 516.364 HBD | @artmom | 800.771 HBD |
| @melvin7 | 269.475 HBD | @dsavings | 147.035 HBD |
| @tamiil | 242.582 HBD | @davedickeyyall | 108.500 HBD |
| @v4vapp.dhf | 200.000 HBD | @luislrt | 104.000 HBD |
| @blrog | 164.318 HBD | @liveofdalla | 50.000 HBD |
| @crypt0gnome | 139.808 HBD | @yintercept | 27.627 HBD |
| @hivesql | 135.000 HBD | @hiveupme | 25.000 HBD |
| @bobby.madagascar | 108.364 HBD | @candelart | 20.498 HBD |
| @bambukah | 100.000 HBD | @davidpena21 | 20.000 HBD |
This graph shows how much and how many accounts store HBD in savings. The table below shows the topmost HBD deposits and withdrawals of the day.

Note: As of 2021-06-30 (HF25) interest is only paid for HBD which are stored in savings.
This chart shows the amount of interest paid each month for holding HBD and how many accounts received such interest.
4. Balances

This graph shows the number of HIVE, both liquid and in savings, held by all accounts.

This graph shows the number of HBD, both liquid and in savings, held by all accounts. It also displays the amount of HBD stored in the Decentralized Hive Fund (DHF).
5. Conversions
Note: As a reminder, conversion requests are only finalized after 3 days. It is only then that it is known exactly how many HIVE were burned in return for the HBD received at the time of the conversion request.

This graph shows the number of HIVE collateralized due to requests to convert HIVE to HBD over the past few days.
 | 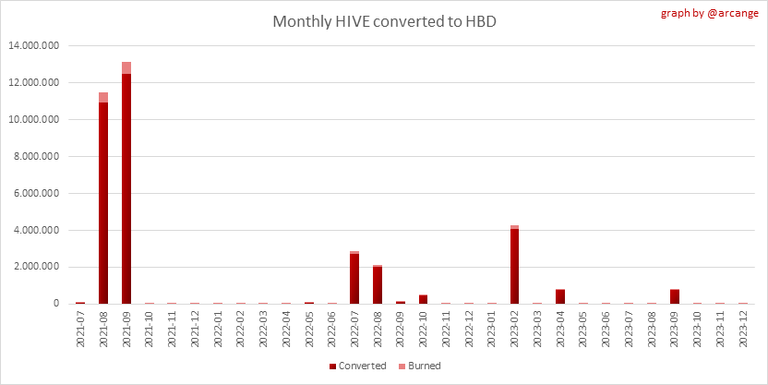 |
These graphs show the number of HIVE effectively used by the conversion process (HIVE converted and 5% HIVE fee which is burned) each day and month when requests to convert HIVE to HBD have been finalized.
 |  |
These graphs show the number of HBD burned, each day and each month, following requests to convert HBD to HIVE.
6. Powerup and Powerdown

| Date | Account | Amount |
|---|---|---|
| 2023-12-27 05:07:03 | @ocd-witness | 35,093.417 HIVE |
| 2023-12-27 09:51:12 | @rotanner | 8,379.109 HIVE |
| 2023-12-27 07:28:18 | @wendyburger | 3,870.600 HIVE |
| 2023-12-27 02:02:00 | @asean.hive | 3,285.817 HIVE |
| 2023-12-27 05:38:33 | @bambuka | 2,589.292 HIVE |
| 2023-12-27 05:38:09 | @bambuka | 2,589.292 HIVE |
| 2023-12-27 10:31:09 | @cur8 | 2,416.408 HIVE |
| 2023-12-27 03:57:54 | @dabeckster | 2,026.038 HIVE |
| 2023-12-27 06:07:39 | @drrune | 1,633.049 HIVE |
| 2023-12-27 09:04:33 | @mangomayhem | 1,371.248 HIVE |
This graph and table show the amount of powerdown initiated over the last 7 days, and the largest initiated on this day.

| Account | Powerup | Account | Powerdown |
|---|---|---|---|
| @spotbtc | 2,032.813 HIVE | @arpolkin | 16,342.295 HIVE |
| @tokenizedsociety | 1,700.000 HIVE | @ocdb | 13,758.531 HIVE |
| @galenkp | 1,508.131 HIVE | @ocd-witness | 6,979.119 HIVE |
| @artmom | 1,052.141 HIVE | @empoderat | 4,505.039 HIVE |
| @epiko | 1,014.875 HIVE | @threespeak | 3,163.867 HIVE |
| @amirl | 350.044 HIVE | @threespeak | 2,485.896 HIVE |
| @bobby.madagascar | 238.518 HIVE | @kevinwong | 1,376.924 HIVE |
| @fieryfootprints | 190.986 HIVE | @captainquack22 | 1,221.318 HIVE |
| @stoodkev | 163.281 HIVE | @godfish | 1,000.559 HIVE |
| @germansailor | 127.000 HIVE | @freeforever | 848.523 HIVE |
This graph shows the daily HIVE power-up, power-down, and the resulting variation over the last 30 days. The table shows the topmost power-ups and power-downs of the day.

This graph shows the monthly HIVE power-up, power-down and the resulting variation.
Values for the last 3 months
| Period | Powerup | Powerdown | Difference |
|---|---|---|---|
| 2023-12 | 761,955.000 | 1,895,797.000 | -1,133,842.000 |
| 2023-11 | 694,882.000 | 2,014,901.000 | -1,320,019.000 |
| 2023-10 | 957,796.000 | 2,029,986.000 | -1,072,190.000 |
7. Transfers
These graphs show the volume (in USD) of HIVE and HBD transferred between accounts.
8. Exchanges
 |  |
These graphs show the amount and distribution of HIVE and HBD stored on the exchanges where they are listed.
 |  |
These graphs show the daily evolution of HIVE and HBD stored on the exchanges where they are listed.
I hope you find those stats useful. If you would like to see additional stats, feel free to drop me a comment. Your feedback is than welcome.
Thanks for reading.
Check out my apps and services


View or trade
BEER.Hey @arcange, here is a little bit of
BEERfrom @pixresteemer for you. Enjoy it!Learn how to earn FREE BEER each day by staking your
BEER.Very nice financial report
Thanks for the mention man! Love your posts, the personal touch is touching.
You're welcome, @amirl! I'm glad you appreciate the reports. Your feedback is also very valuable.
Thanks, please help support Israel by reading my latest posts on the war against Hamas. You can filter out the chess related posts and comments.
Great and interesting states.
Thanks for the update
It was a good one
Интересная информация. Ещё бы узнать, как мне достать мои 100HBD ;-)
Cheers and !BEER
!invest_vote ✔️
View or trade
BEER.Hey @arcange, here is a little bit of
BEERfrom @bambuka for you. Enjoy it!We love your support by voting @detlev.witness on HIVE .
@bambuka denkt du hast ein Vote durch @investinthefutur verdient!
@bambuka thinks you have earned a vote of @investinthefutur !