Hive Financial Statistics – 2023.03.19

Welcome to the daily financial report about the Hive blockchain.
All the information presented in this report is based on the data collected from the blockchain until 2023-03-19 midnight UTC. This report aims to provide you with a clear view of what is happening on the Hive blockchain.
 Este post está traducido al español - aquí
 Dieser Beitrag ist ins Deutsche übersetzt - hier
 Une version en français de ce post est disponible - ici
1. Price
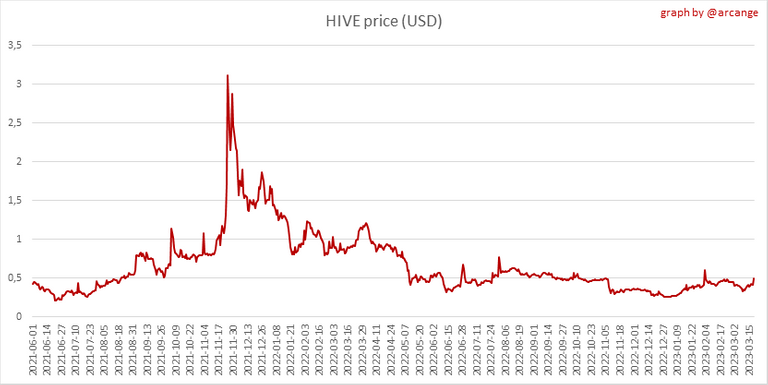 | 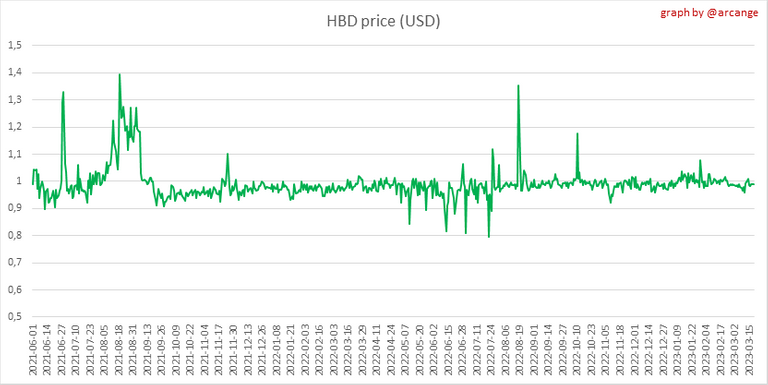 |
These graphs show the evolution of prices in USD for HIVE and HBD.
2. Supply
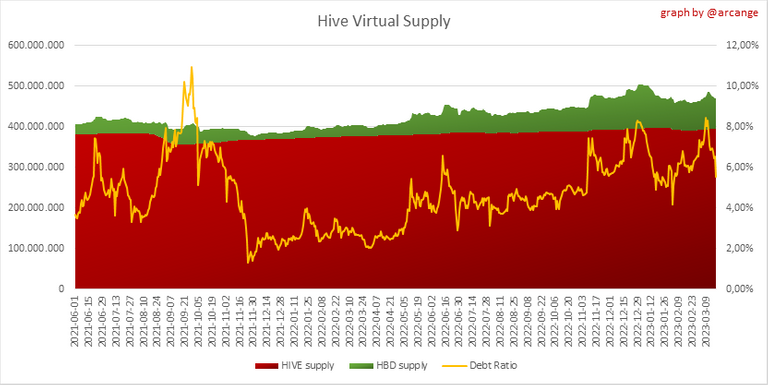
This graph shows the evolution of HIVE virtual Supply. The virtual supply is the sum of HIVE supply (liquid and staked HIVE) and HBD supply (converted into HIVE).
The graph also displays the debt ratio (HBD supply / HIVE virtual supply). Keep in mind that since hardfork 24 funds in the treasury (@hive.fund HBD balance) don't count towards the HBD debt ratio.
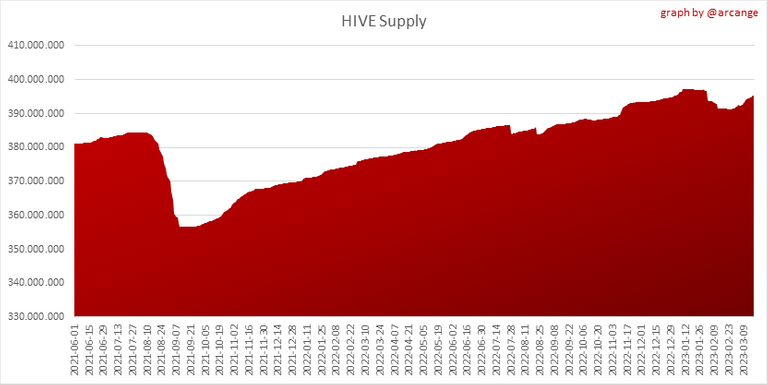 | 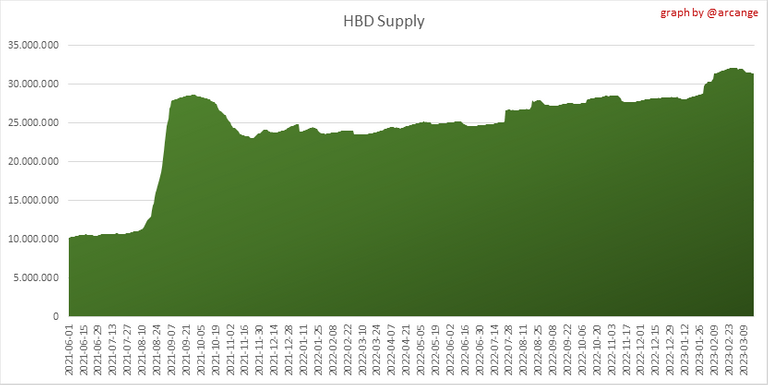 |
These graphs show the evolution of the HIVE Supply (both liquid and staked) and the HBD supply.
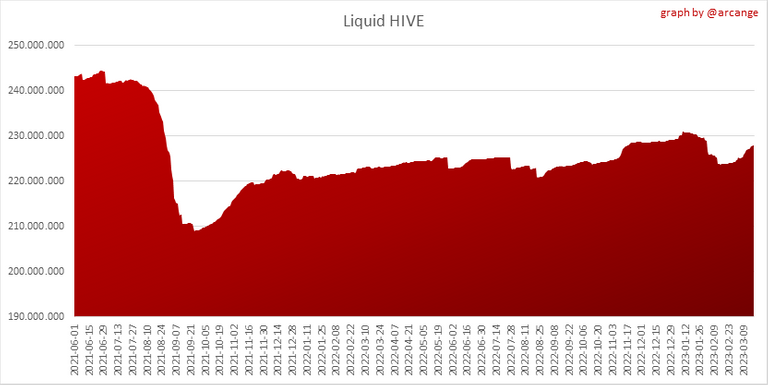 | 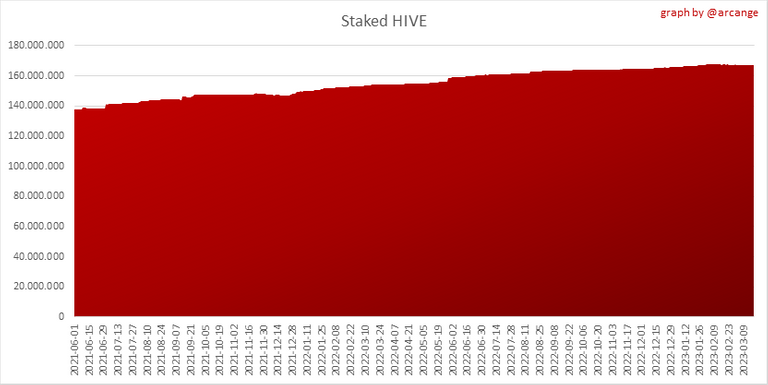 |
These charts show the evolution of the liquid HIVE and the staked HIVE (Hive Power).
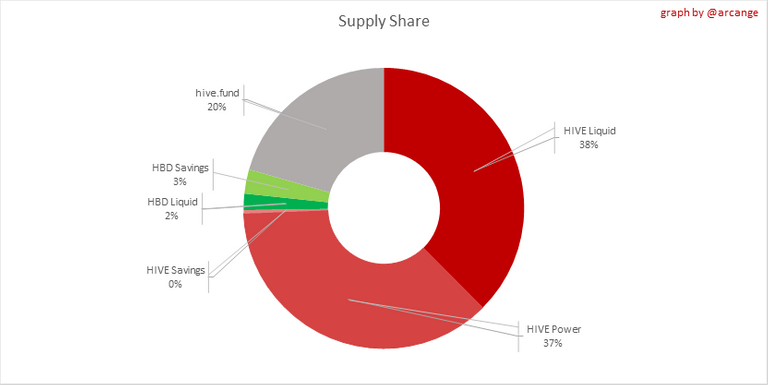
This graph shows the overall Hive tokens distribution.
3. HBD Savings
| Account | Deposit | Account | Withdrawal |
|---|---|---|---|
| @ipromote | 5,584.523 HBD | @bryan-imhoff | 1,801.108 HBD |
| @mika | 2,000.000 HBD | @mup | 328.750 HBD |
| @rmsadkri | 1,969.792 HBD | @johnhtims.life | 200.000 HBD |
| @muenchen | 855.127 HBD | @fantom22 | 195.825 HBD |
| @drakos | 840.000 HBD | @risingstarhub | 106.000 HBD |
| @cranium | 546.854 HBD | @samsmith1971 | 100.000 HBD |
| @vlemon | 426.034 HBD | @loretrina | 100.000 HBD |
| @michiel87 | 371.458 HBD | @vickoly | 84.222 HBD |
| @mangowambo | 370.324 HBD | @thelastlaugh99 | 68.634 HBD |
| @break-out-trader | 345.223 HBD | @bhoa | 50.830 HBD |
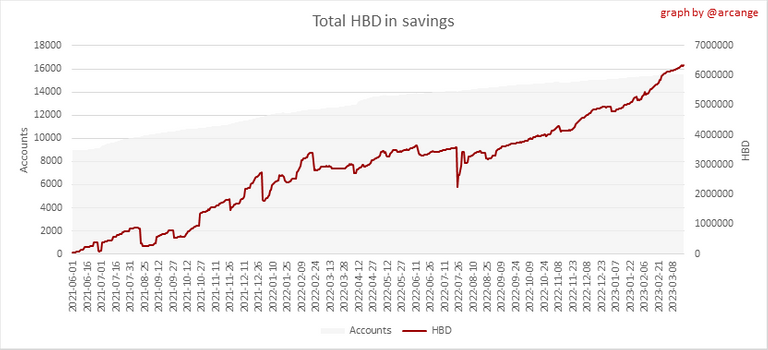
This graph shows how much and how many accounts store HBD in savings. The table below shows the topmost HBD deposits and withdrawals of the day.
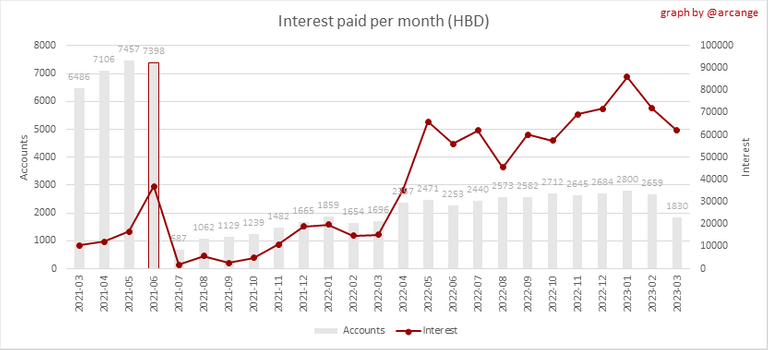
Note: As of 2021-06-30 (HF25) interest is only paid for HBD which are stored in savings.
This chart shows the amount of interest paid each month for holding HBD and how many accounts received such interest.
4. Balances
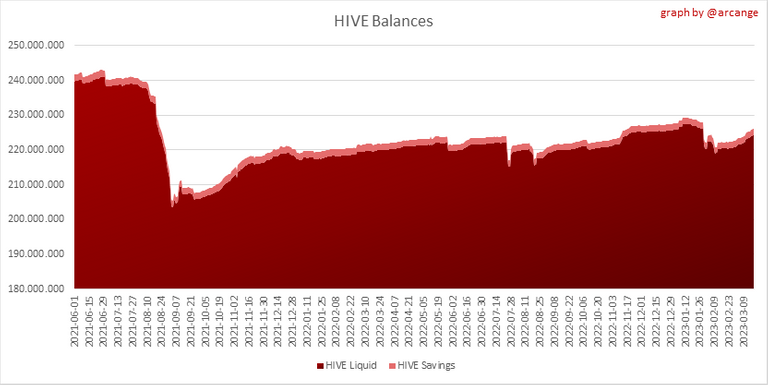
This graph shows the number of HIVE, both liquid and in savings, held by all accounts.
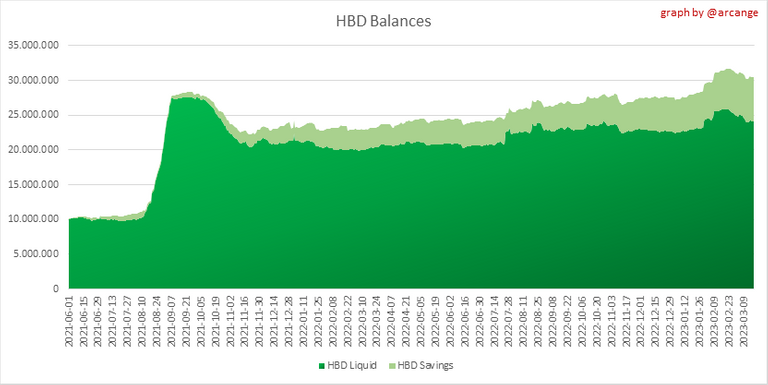
This graph shows the number of HBD, both liquid and in savings, held by all accounts.
5. Conversions
Note: As a reminder, conversion requests are only finalized after 3 days. It is only then that it is known exactly how many HIVE were burned in return for the HBD received at the time of the conversion request.
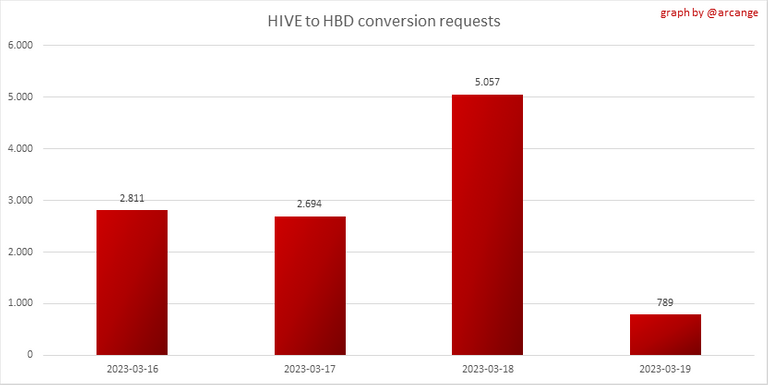
This graph shows the number of HIVE collateralized due to requests to convert HIVE to HBD over the past few days.
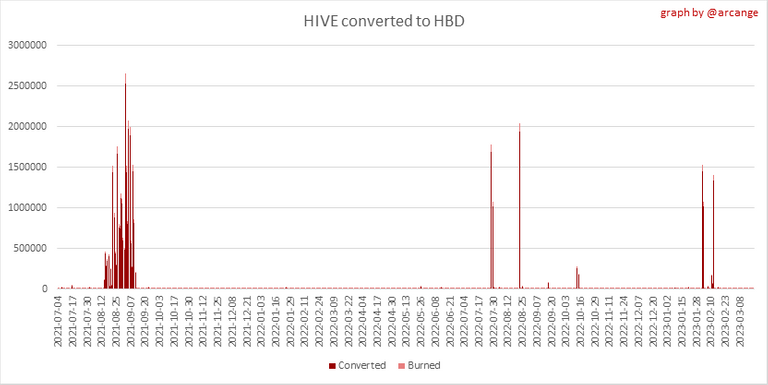 | 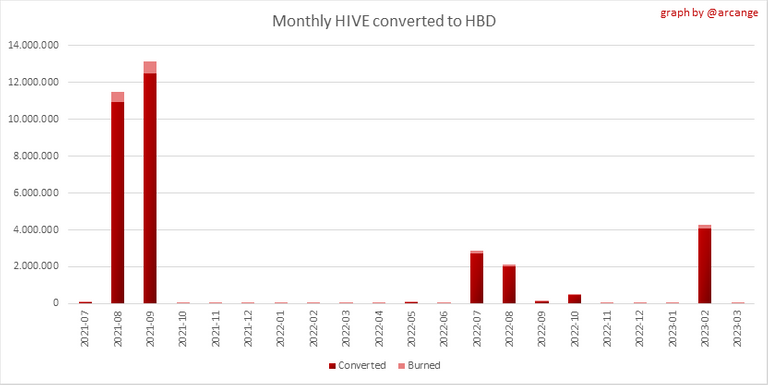 |
These graphs show the number of HIVE effectively used by the conversion process (HIVE converted and 5% HIVE fee which is burned) each day and month when requests to convert HIVE to HBD have been finalized.
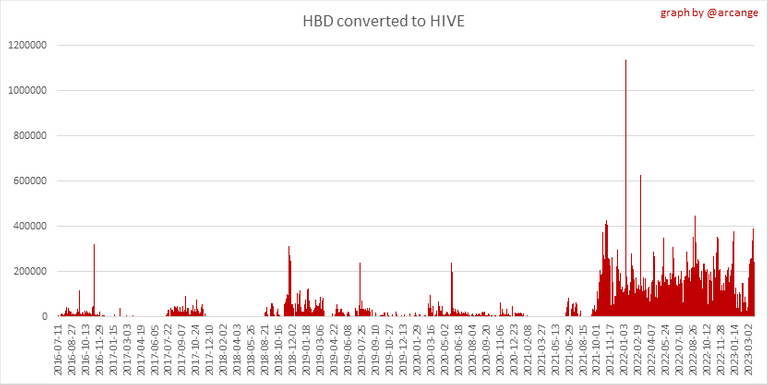 | 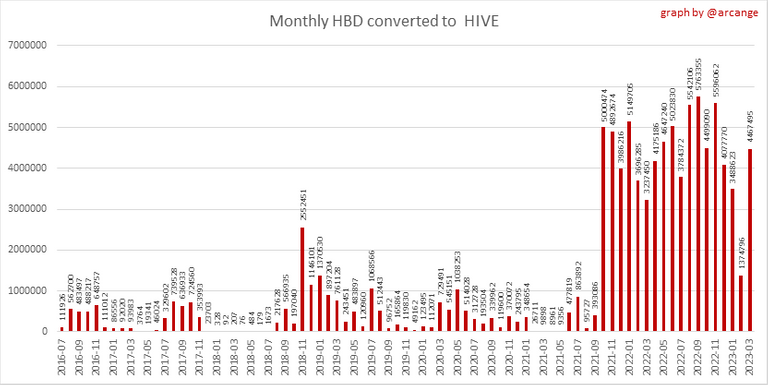 |
These graphs show the number of HBD burned, each day and each month, following requests to convert HBD to HIVE.
6. Powerup and Powerdown
| Date | Account | Amount |
|---|---|---|
| 2023-03-19 01:12:57 | @riverhead | 435,577.553 HIVE |
| 2023-03-19 02:45:27 | @jacuzzi | 59,372.736 HIVE |
| 2023-03-19 05:15:12 | @nateaguila | 51,806.162 HIVE |
| 2023-03-19 04:55:06 | @outlinez | 7,000.232 HIVE |
| 2023-03-19 10:20:18 | @betterthanhome | 6,748.370 HIVE |
| 2023-03-19 02:30:33 | @mintrawa | 5,863.281 HIVE |
| 2023-03-19 03:42:57 | @martibis | 5,356.199 HIVE |
| 2023-03-19 09:29:30 | @don.quijote | 5,254.416 HIVE |
| 2023-03-19 09:30:27 | @simon.bolivar | 5,026.138 HIVE |
| 2023-03-19 09:30:15 | @sancho.panza | 4,976.210 HIVE |
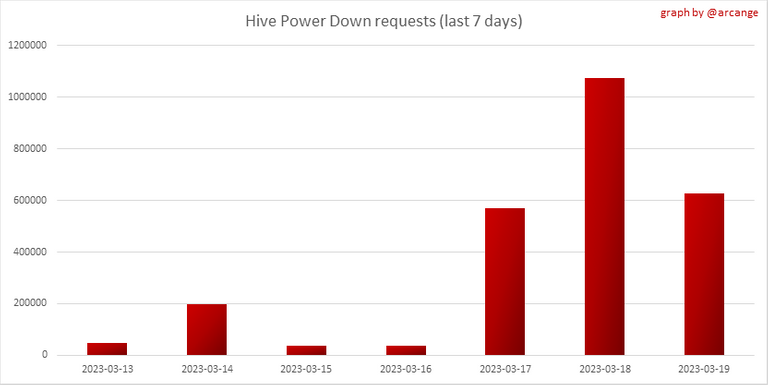
This graph and table show the amount of powerdown initiated over the last 7 days, and the largest initiated on this day.
| Account | Powerup | Account | Powerdown |
|---|---|---|---|
| @foodchunk | 2,014.842 HIVE | @god0 | 3,869.998 HIVE |
| @god0 | 1,000.000 HIVE | @guiltyparties | 3,001.682 HIVE |
| @rabona | 923.852 HIVE | @urri2020 | 2,483.759 HIVE |
| @ace108 | 666.000 HIVE | @deathwing | 2,008.845 HIVE |
| @terracore | 601.322 HIVE | @choppy | 1,774.397 HIVE |
| @methodofmad | 402.325 HIVE | @roleerob | 1,609.583 HIVE |
| @allkarton | 200.000 HIVE | @curie | 1,506.632 HIVE |
| @cmmd1008 | 160.116 HIVE | @acom | 1,476.426 HIVE |
| @demotruk | 124.027 HIVE | @eroche | 1,079.117 HIVE |
| @bcarolan639 | 100.489 HIVE | @bryan-imhoff | 952.045 HIVE |
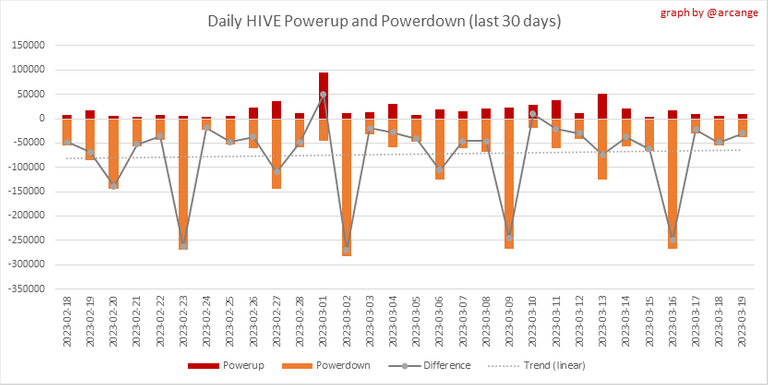
This graph shows the daily HIVE power-up, power-down, and the resulting variation over the last 30 days. The table shows the topmost power-ups and power-downs of the day.
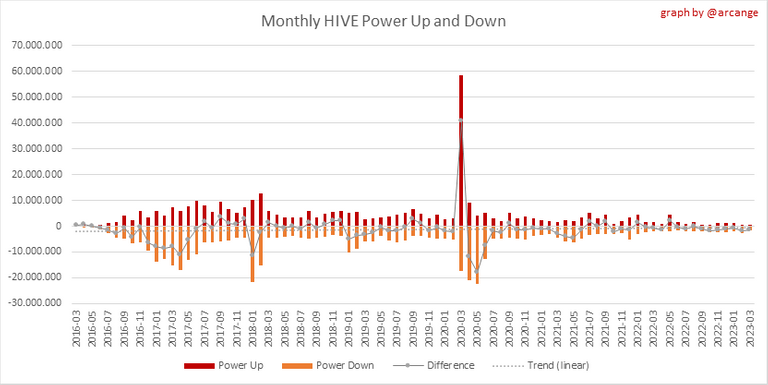
This graph shows the monthly HIVE power-up, power-down and the resulting variation.
Values for the last 3 months
| Period | Powerup | Powerdown | Difference |
|---|---|---|---|
| 2023-03 | 431,330.000 | 1,750,176.000 | -1,318,846.000 |
| 2023-02 | 606,221.000 | 2,537,169.000 | -1,930,948.000 |
| 2023-01 | 1,360,922.000 | 1,914,402.000 | -553,480.000 |
7. Transfers
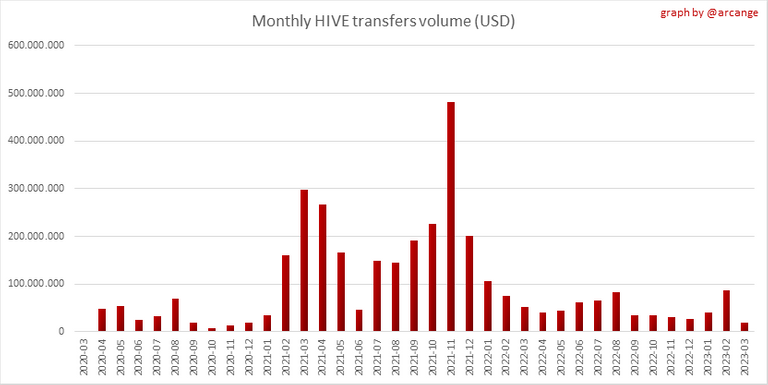 | 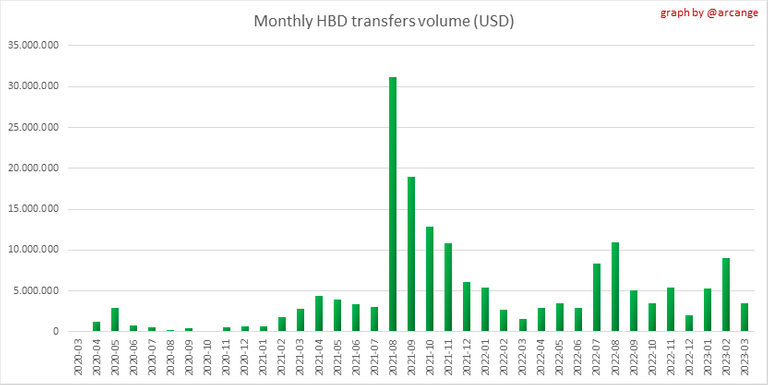 |
These graphs show the volume (in USD) of HIVE and HBD transferred between accounts.
8. Exchanges
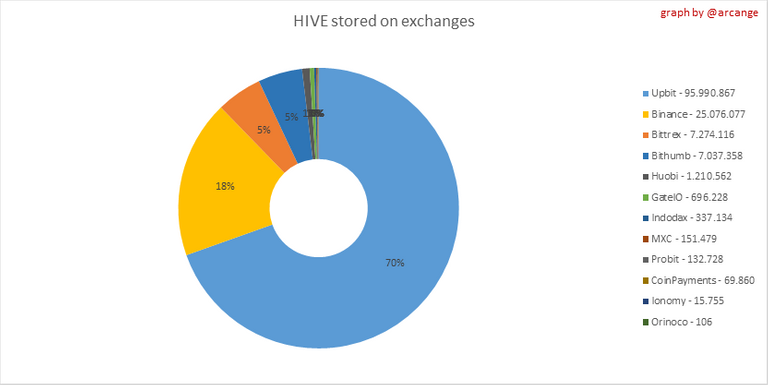 | 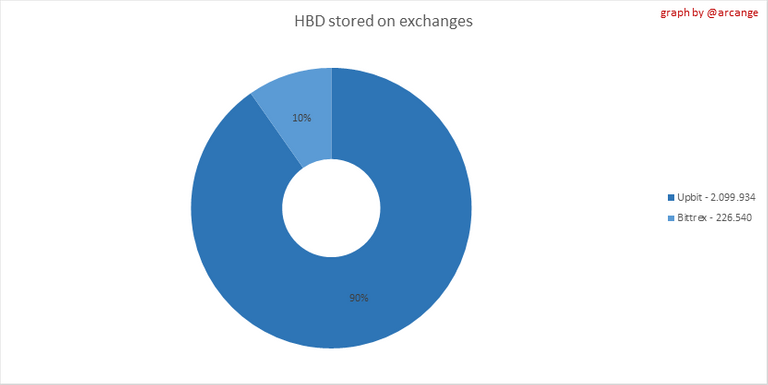 |
These graphs show the amount and distribution of HIVE and HBD stored on the exchanges where they are listed.
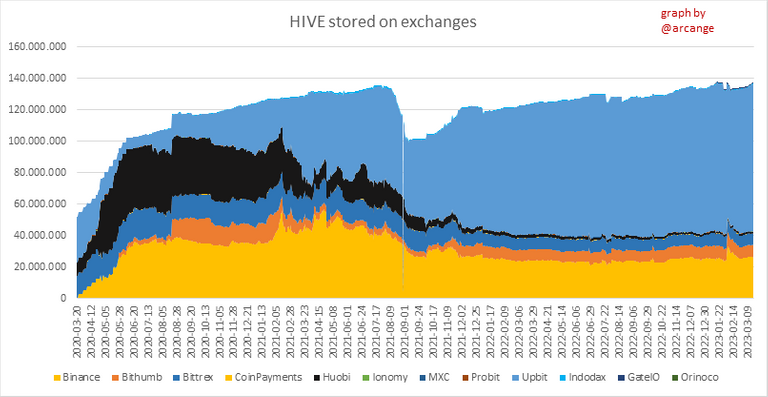 | 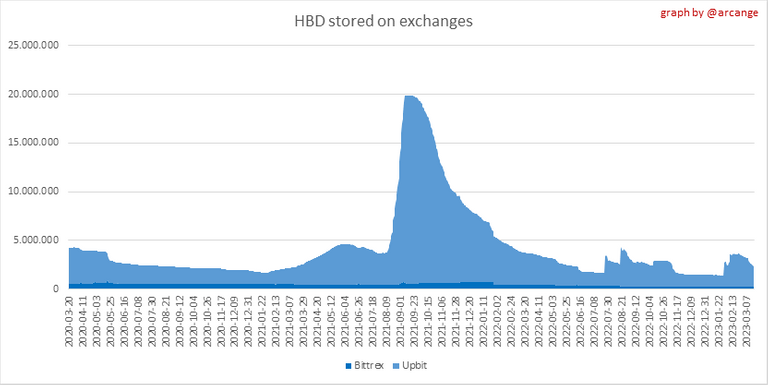 |
These graphs show the daily evolution of HIVE and HBD stored on the exchanges where they are listed.
I hope you find those stats useful. If you would like to see additional stats, feel free to drop me a comment. Your feedback is than welcome.
Thanks for reading.


View or trade
BEER.Hey @arcange, here is a little bit of
BEERfrom @pixresteemer for you. Enjoy it!Did you know that <a href='https://dcity.io/cityyou can use BEER at dCity game to buy cards to rule the world.
That is correct I'm powering down my account. Until we remove the download button, or until there's a better solution in place for it, I don't see a future for our platform as a social media platform. As such I don't see any reason to keep a large stake powered up. :/
No prob, everyone is free to do what they want with their assets.
https://twitter.com/1635648678189776898/status/1637695614002528257
The rewards earned on this comment will go directly to the people( @itwithsm ) sharing the post on Twitter as long as they are registered with @poshtoken. Sign up at https://hiveposh.com.
37% stake is not so bad but we can do better with that and it looks like their value of power down happening is ever more than power up on the blockchain. Will you say this is because of the downside of the market?
It should be expected and treated as normal that there will be more powering down of Hive Power than powering up. The vast majority of newly created Hive is in the form of Hive Power. Almost none is created as liquid Hive. Therefore, simply to maintain an equilibrium ratio of Hive to Hive Power, a positive net powerdown has to happen every day.
Oh, that makes sense then. I think understanding the dynamics is key. Thank you.
It's possible that the current market conditions are contributing to the higher power-downs. Users may choose to withdraw their staked tokens and sell them for other assets or convert them into stablecoins to protect their value. That being said, one needs to consider multiple factors when analyzing these trends, as they could be influenced by several reasons beyond market conditions.
That makes sense, I can think of people who power-down to take care of immediately needs so it is a good thing to be open minded on the subject. Thanks for your attention
You're welcome