Hive Financial Statistics – 2022.07.04

Welcome to the daily financial report about the Hive blockchain.
All the information presented in this report is based on the data collected from the blockchain until 2022-07-04 midnight UTC. This report aims to provide you with a clear view of what is happening on the Hive blockchain.
 Este post está traducido al español - aquí
 Dieser Beitrag ist ins Deutsche übersetzt - hier
 Une version en français de ce post est disponible - ici
1. Price
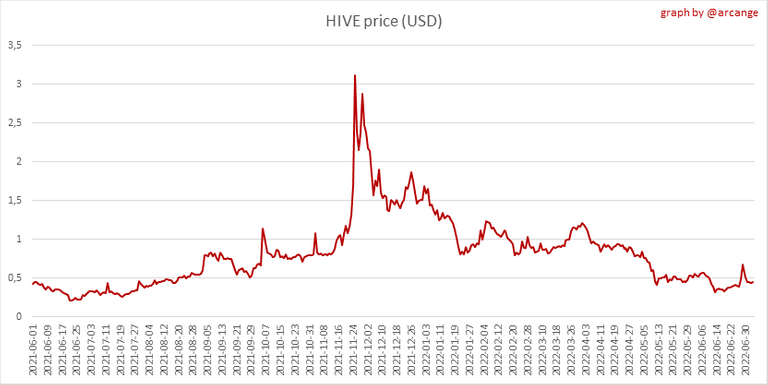 | 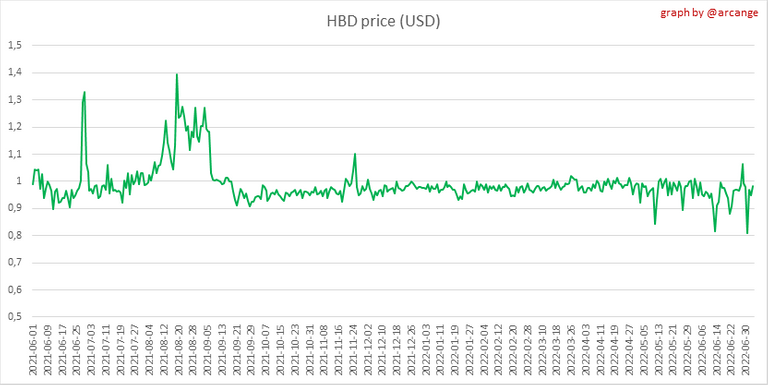 |
These graphs show the evolution of prices in USD for HIVE and HBD.
2. Supply
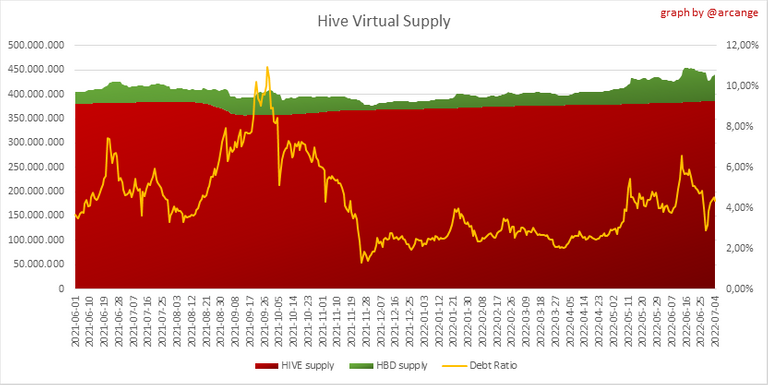
This graph shows the evolution of HIVE virtual Supply. The virtual supply is the sum of HIVE supply (liquid and staked HIVE) and HBD supply (converted into HIVE).
The graph also displays the debt ratio (HBD supply / HIVE virtual supply). Keep in mind that since hardfork 24 funds in the treasury (@hive.fund HBD balance) don't count towards the HBD debt ratio.
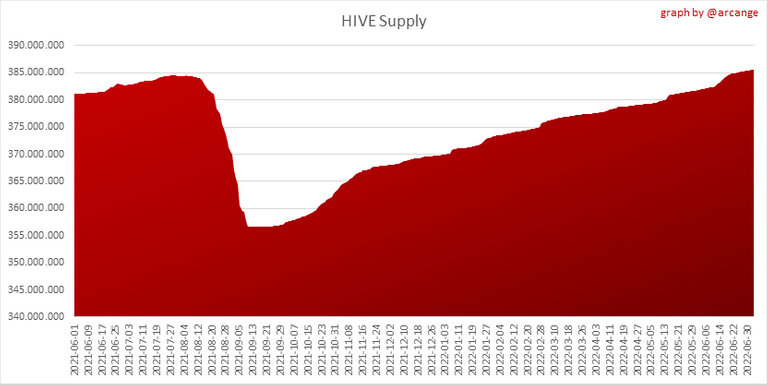 | 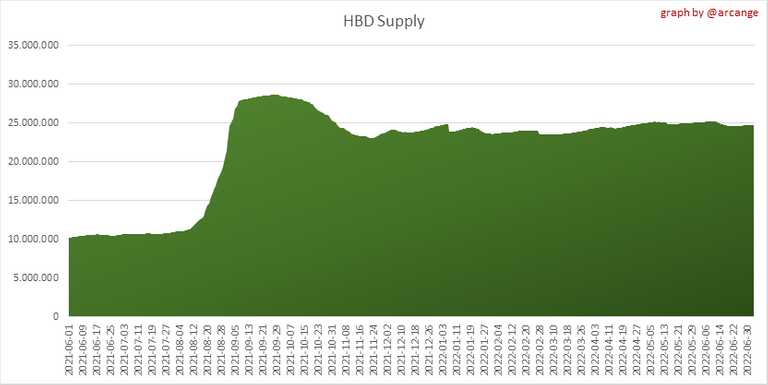 |
These graphs show the evolution of the HIVE Supply (both liquid and staked) and the HBD supply.
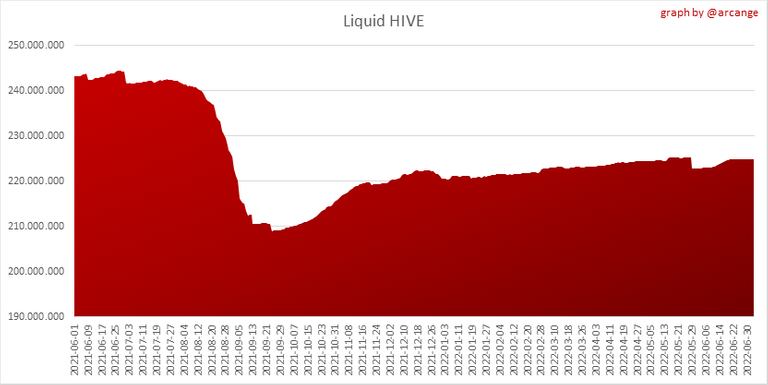 | 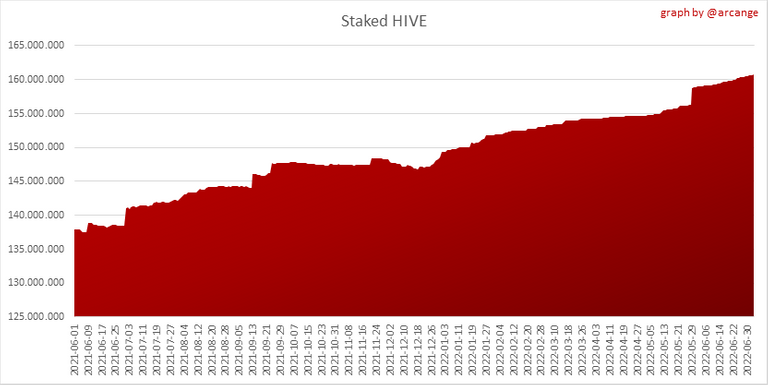 |
These charts show the evolution of the liquid HIVE and the staked HIVE (Hive Power).

This graph shows the overall Hive tokens distribution.
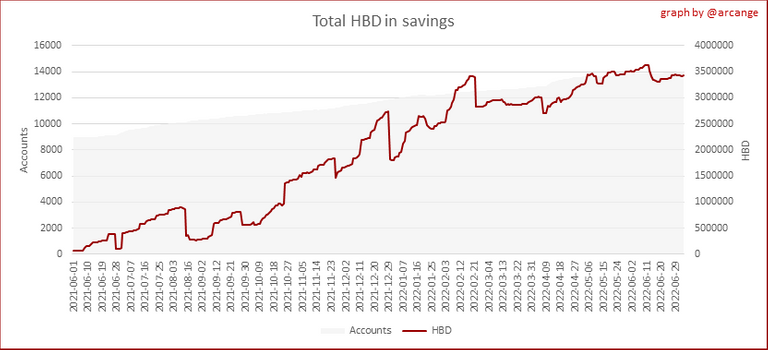
3. HBD Savings
| Account | Deposit | Account | Withdrawal |
|---|---|---|---|
| @stoodkev | 3,503.791 HBD | @keychain | 11,845.806 HBD |
| @investegg | 2,948.260 HBD | @fbslo | 5,502.181 HBD |
| @xg4028 | 1,992.280 HBD | @hivechain.app | 2,500.000 HBD |
| @lucius.banda | 1,771.853 HBD | @gric | 791.041 HBD |
| @hivechain.app | 1,500.000 HBD | @charsdesign | 549.923 HBD |
| @theghost1980 | 1,000.000 HBD | @abdex9 | 475.519 HBD |
| @v4vapp.dhf | 800.000 HBD | @knowhow92 | 400.000 HBD |
| @bluerobo | 486.867 HBD | @psorigins | 384.101 HBD |
| @keychain | 373.764 HBD | @teesart | 313.334 HBD |
| @hiveauth | 324.995 HBD | @steemstem.pay | 311.123 HBD |
This graph shows how much and how many accounts store HBD in savings. The table below shows the topmost HBD deposits and withdrawals of the day.
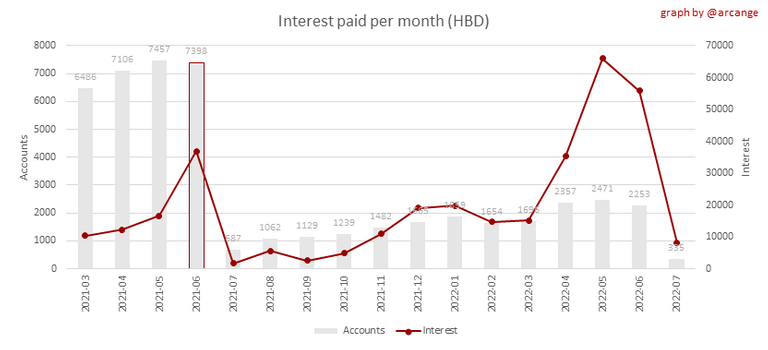
Note: As of 2021-06-30 (HF25) interest is only paid for HBD which are stored in savings.
This chart shows the amount of interest paid each month for holding HBD and how many accounts received such interest.
4. Balances
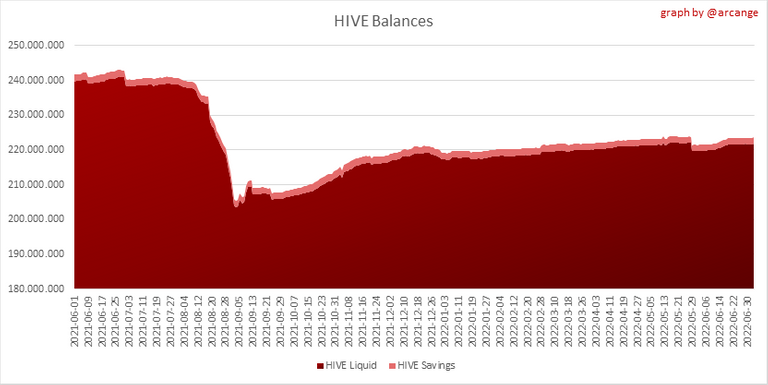
This graph shows the number of HIVE, both liquid and in savings, held by all accounts.
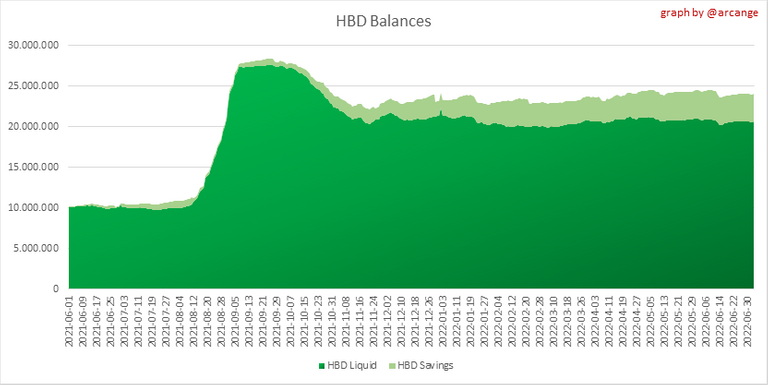
This graph shows the number of HBD, both liquid and in savings, held by all accounts.
5. Conversions
Note: As a reminder, conversion requests are only finalized after 3 days. It is only then that it is known exactly how many HIVE were burned in return for the HBD received at the time of the conversion request.
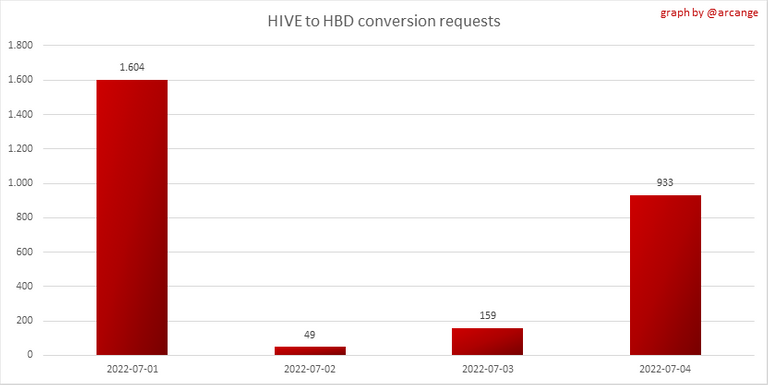
This graph shows the number of HIVE collateralized due to requests to convert HIVE to HBD over the past few days.
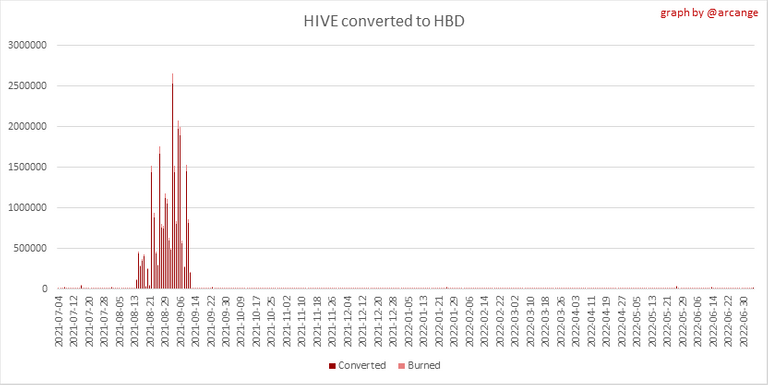 | 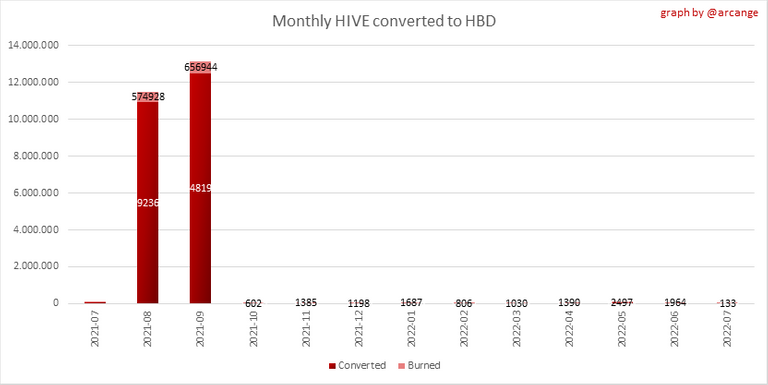 |
These graphs show the number of HIVE effectively used by the conversion process (HIVE converted and 5% HIVE fee which is burned) each day and month when requests to convert HIVE to HBD have been finalized.
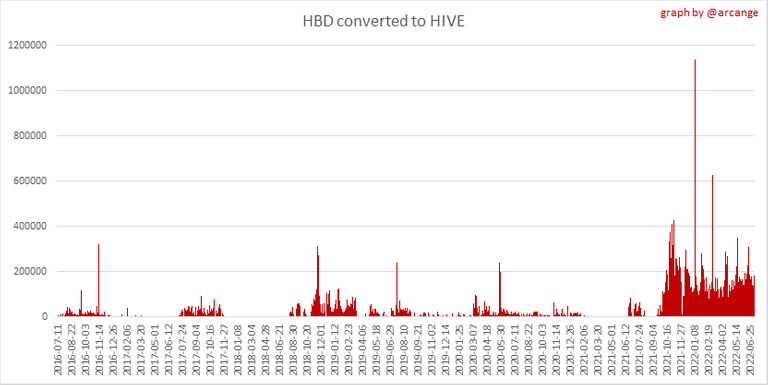 | 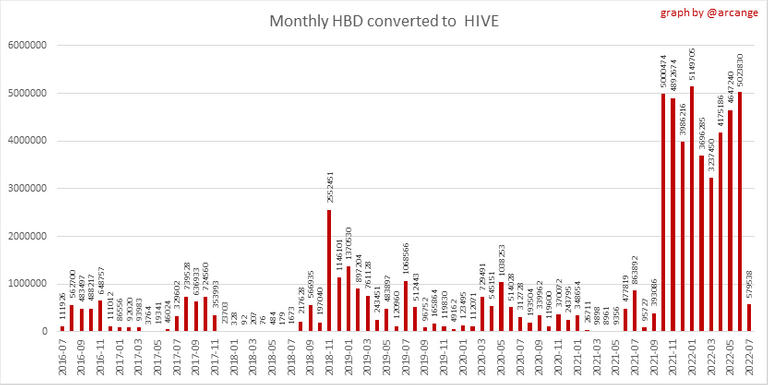 |
These graphs show the number of HBD burned, each day and each month, following requests to convert HBD to HIVE.
6. Powerup and Powerdown
| Date | Account | Amount |
|---|---|---|
| 2022-07-04 04:23:48 | @encrypt3dbr0k3r | 41,358.097 HIVE |
| 2022-07-04 09:14:24 | @ellocoempresario | 32,186.736 HIVE |
| 2022-07-04 02:17:03 | @steempty | 18,201.153 HIVE |
| 2022-07-04 02:14:33 | @steempty | 15,600.991 HIVE |
| 2022-07-04 04:23:21 | @thejohalfiles | 11,158.893 HIVE |
| 2022-07-04 02:34:48 | @broncnutz | 10,495.297 HIVE |
| 2022-07-04 01:59:21 | @lizelle | 6,094.872 HIVE |
| 2022-07-04 01:15:42 | @scrooger | 5,722.862 HIVE |
| 2022-07-04 02:41:51 | @martinphoto | 3,357.903 HIVE |
| 2022-07-04 10:55:09 | @lanzjoseg | 3,263.609 HIVE |
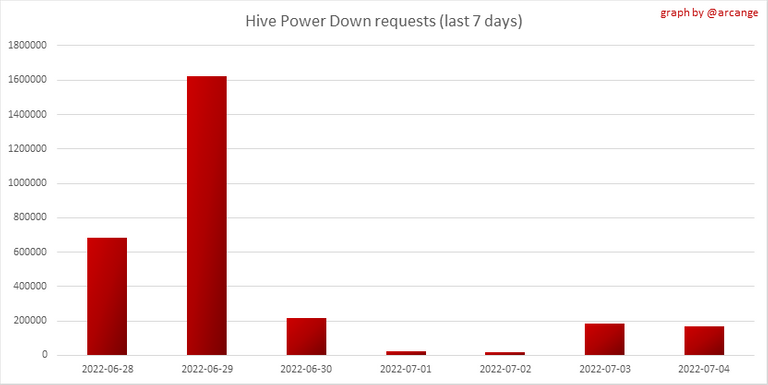
This graph and table show the amount of powerdown initiated over the last 7 days, and the largest initiated on this day.
| Account | Powerup | Account | Powerdown |
|---|---|---|---|
| @hedge-x | 7,482.948 HIVE | @appreciator | 20,068.003 HIVE |
| @myegoandmyself | 5,000.000 HIVE | @steemik | 8,166.954 HIVE |
| @bo022 | 1,200.000 HIVE | @pharesim | 2,874.665 HIVE |
| @buynano | 1,000.000 HIVE | @bdvoter | 2,789.712 HIVE |
| @balte | 876.000 HIVE | @followbtcnews | 2,475.426 HIVE |
| @filosof103 | 700.000 HIVE | @deathwing | 2,005.655 HIVE |
| @giker | 675.000 HIVE | @dcityrewards | 1,780.862 HIVE |
| @a04 | 599.980 HIVE | @comet.ranker | 1,519.547 HIVE |
| @sbi2 | 573.692 HIVE | @catwomanteresa | 832.181 HIVE |
| @buggedout | 543.041 HIVE | @theouterlight | 807.967 HIVE |
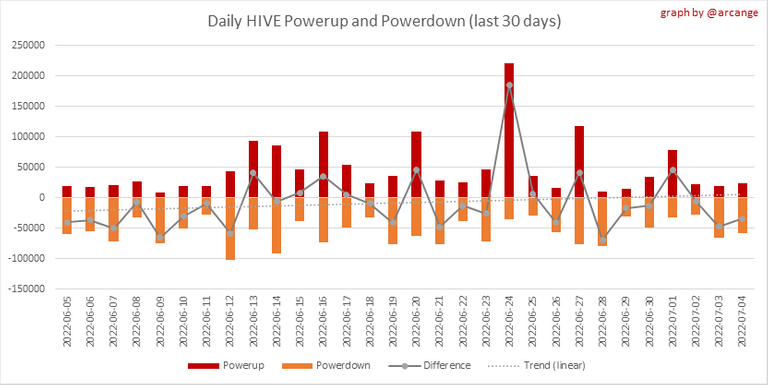
This graph shows the daily HIVE power-up, power-down, and the resulting variation over the last 30 days. The table shows the topmost power-ups and power-downs of the day.
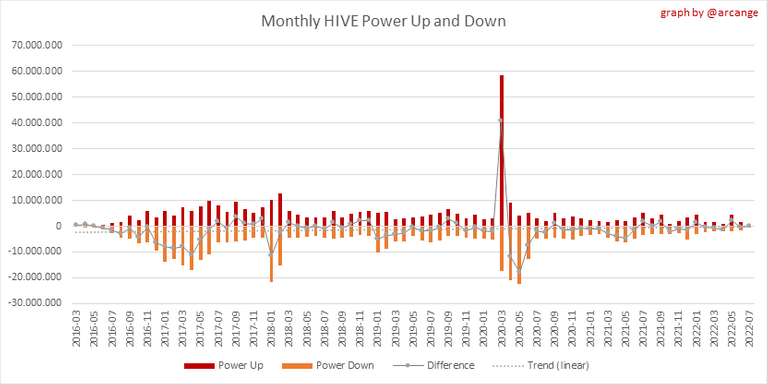
This graph shows the monthly HIVE power-up, power-down and the resulting variation.
Values for the last 3 months
| Period | Powerup | Powerdown | Difference |
|---|---|---|---|
| 2022-07 | 143,879.000 | 185,276.000 | -41,397.000 |
| 2022-06 | 1,444,478.000 | 1,698,001.000 | -253,523.000 |
| 2022-05 | 4,321,244.000 | 2,069,335.000 | 2,251,909.000 |
7. Transfers
These graphs show the volume (in USD) of HIVE and HBD transferred between accounts.
8. Exchanges
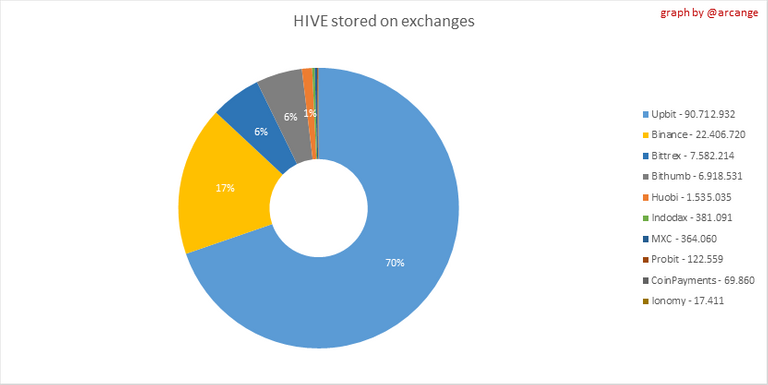 | 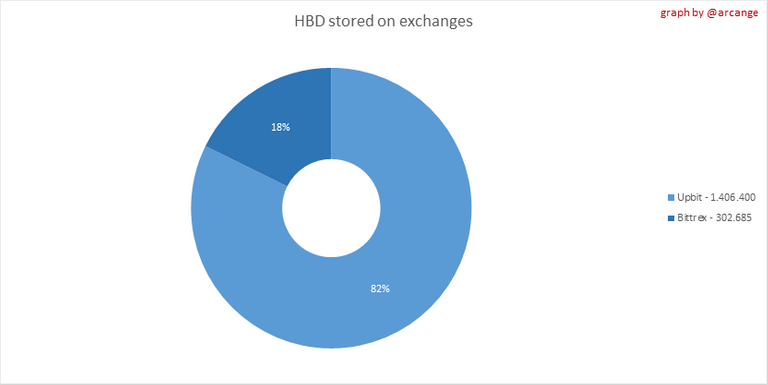 |
These graphs show the amount and distribution of HIVE and HBD stored on the exchanges where they are listed.
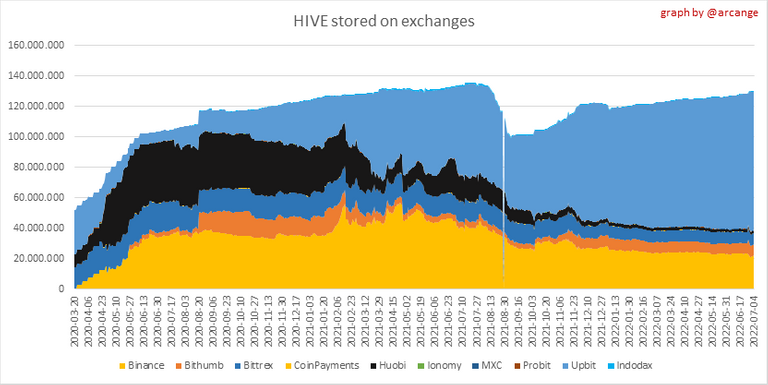 | 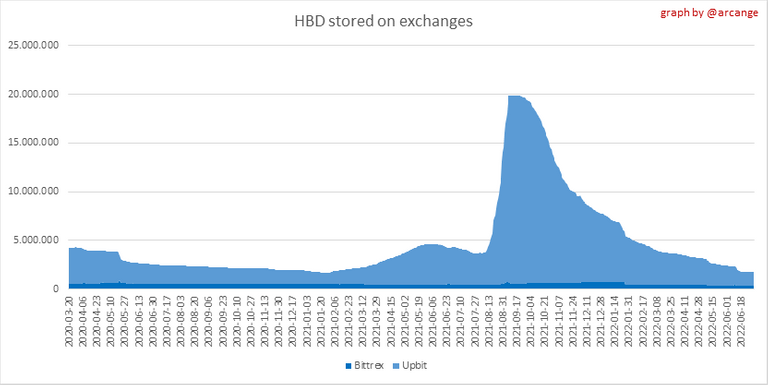 |
These graphs show the daily evolution of HIVE and HBD stored on the exchanges where they are listed.
I hope you find those stats useful. If you would like to see additional stats, feel free to drop me a comment. Your feedback is than welcome.
Thanks for reading.
Check out my apps and services


😊 nice
HIVE is GREAT! !LOLZ
lolztoken.com
They're always taking things literally.
Credit: lofone
@arcange, I sent you an $LOLZ on behalf of @anuk
Did you know that $LOLZ is a Dividend Token too? Find out more at LOLZ Defi.
(1/1)