Montly Price Correction Started on Bitcoin Price Chart
Bitcoin has entered daily and weekly price correction. I shared lots of analysis and said Price correction was coming. Bitcoin entered daily and weekly price correction.
After completing the last day of April, we woke up red monthly candle. This is the first day of the new month, May started with red monthly candle. If we see red monthly candle in this month, I will be sure monthly price correction started. I think we will see red monthly candle in this month. Because, Sell in May and go away is true..
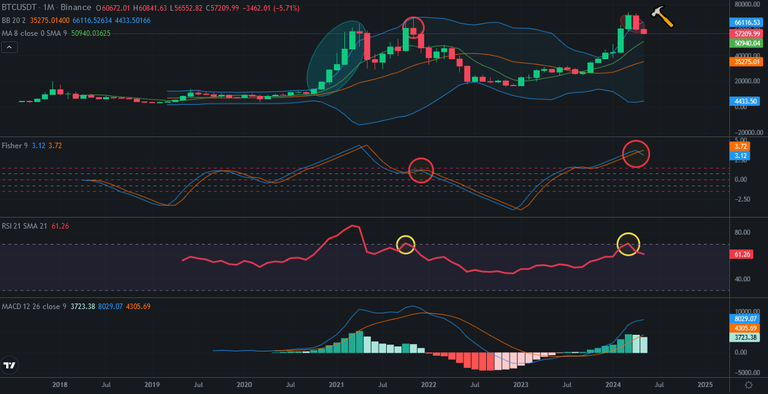
Here you can see monthly chart of Bitcoin. We are in 2nd red monthly candle after 7 green monthly candles. We have never seen 8 green monthly candles in Bitcoin price chart and That is why we saw red candle on monthly candle in April!
Fisher Indicator reversed from the top. This is the proof of entering monthly price correction on Bitcoin price chart! I may take a few months!
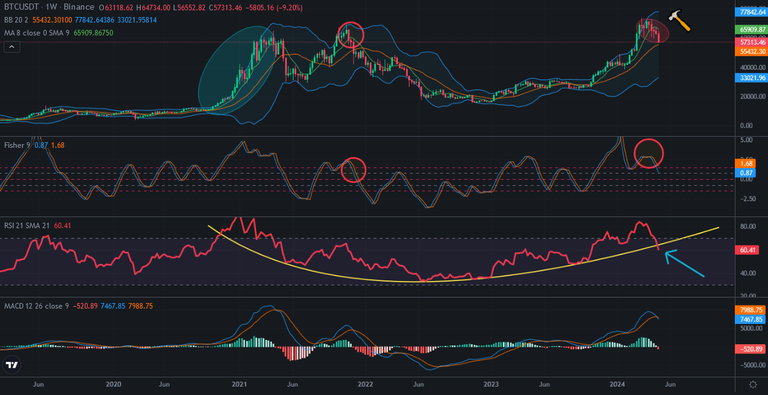
When we look at weekly chart of Bitcoin. There was a bowl pattern on RSI Indicator. If we see weekly close at this level, this pattern will end. It will be proof of price correction. Bitcoin will draw new pattern!
MACD Indicator reversed from the top. I will take a few weeks for weekly price correction. This price dumps may be only the beginnings..
May is important. If market sell in May and goes away, we will wait until September.
We will see..
Posted Using InLeo Alpha